
 graphique
arbre de décision
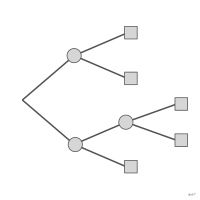
Arbre qui enchaîne, de la racine vers les feuilles, des choix et des événements incertains jusqu'aux issues possibles de chaque chemin.
decision tree
Tree that chains choices and uncertain events, from the root to the leaves, up to the possible outcomes of each path.
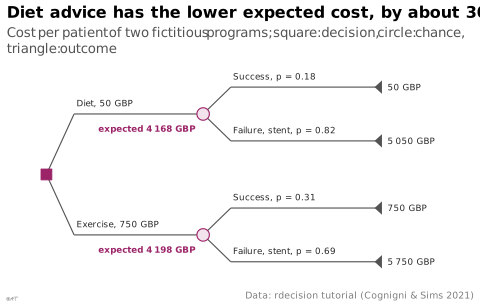
Au sens de l'aide à la décision : nœuds de décision, de hasard et issues, souvent chiffrés de probabilités et de gains. Le modèle d'apprentissage automatique (CART, rpart) en est un cas, que l'on représente sous cette forme. À distinguer du guide de choix graphique, arbre de décision dont les issues sont des types de graphique.
Classification
- graphique
- réseaux et arbres › réseaux schématiques
- flux
- le nom évoque : nature
Canaux
 position sur une échelle commune; secondaire : moment de la décision (quand l'arbre suit une échelle de temps (Harris 1996))
 région de l'espace; principal : étape du chemin
 forme; principal : nature du nœud (carré de décision, rond de hasard, triangle d'issue)
Attestation et synonymies
- terme français : Wikipédia en français↗
- définition anglaise : Information Graphics: A Comprehensive Illustrated Reference
- decision chart; Information Graphics: A Comprehensive Illustrated Reference
- diagramme décisionnel; datavizindex.fr
Littérature scientifique
Paquets R
- R
rdecision::DecisionTree(); tutoriel; GitHub; article Classe R6 ; le dessin passe par sa méthode draw().
Code R de l'exemple ggplot2
library(ggplot2)
library(dplyr)
## The fictitious lifestyle-advice problem of the rdecision tutorial
## (vignette DT00-DecisionTreeTutorial, Cognigni & Sims 2021, GPL-3), copied
## here so that the script does not need rdecision. Diet advice costs 50 GBP,
## the exercise programme 750 GBP; a programme that fails leads to a stent,
## 5000 GBP. Success: 12 of 68 patients on diet, 18 of 58 on exercise.
cost <- c(Diet = 50, Exercise = 750)
cost_stent <- 5000
p_success <- c(Diet = 12 / 68, Exercise = 18 / 58)
## Rolled back: expected cost of each programme per patient.
expected <- cost + (1 - p_success) * cost_stent
## The gap between the rounded costs shown on the tree.
gap <- round(expected[["Exercise"]]) - round(expected[["Diet"]])
stopifnot(round(expected[["Diet"]]) == 4168, round(expected[["Exercise"]]) == 4198, gap == 30)
gbp <- \(x) paste(lex_number(round(x)), "GBP")
chance <- tibble(programme = names(cost), x = 38, y = c(4.5, -4.5))
leaves <- chance |>
reframe(programme = rep(programme, each = 2), outcome = rep(c("Success", "Failure"), 2),
x = 76, y = rep(y, each = 2) + rep(c(2, -2), 2)) |>
mutate(p = ifelse(outcome == "Success", p_success[programme], 1 - p_success[programme]),
path_cost = cost[programme] + ifelse(outcome == "Failure", cost_stent, 0),
edge = paste0(ifelse(outcome == "Failure", "Failure, stent", "Success"), ", p = ",
format(round(p, 2), nsmall = 2)))
## Each branch fans out from its node, then runs level to its child, which
## carries the branch label above it.
fan <- 6
edges <- bind_rows(
transmute(chance, xend = x, yend = y, x = 4, y = 0, xbend = 4 + fan,
label = paste0(programme, ", ", gbp(cost[programme]))),
transmute(leaves, xend = x, yend = y, x = 38, y = chance$y[match(programme, chance$programme)],
xbend = 38 + fan, label = edge)
)
triangles <- leaves |>
rowwise() |>
reframe(leaf = paste(programme, outcome), x = x + c(-0.8, 0.8, 0.8), y = y + c(0, 0.5, -0.5))
p <- ggplot() +
geom_segment(data = edges, aes(x = x, y = y, xend = xbend, yend = yend), colour = "#535353", linewidth = 0.4) +
geom_segment(data = edges, aes(x = xbend, y = yend, xend = xend, yend = yend), colour = "#535353", linewidth = 0.4) +
geom_text(data = edges, aes(x = xbend + 0.5, y = yend + 0.8, label = label), hjust = 0, size = 2.3,
colour = "#262626") +
geom_point(aes(x = 4, y = 0), shape = 22, size = 4, fill = "#9b2367", colour = "#9b2367") +
geom_point(data = chance, aes(x = x, y = y), shape = 21, size = 4, fill = "#f3e3ec", colour = "#9b2367",
stroke = 0.6) +
geom_text(data = chance, aes(x = x - 1.5, y = y - 1.1, label = paste("expected", gbp(expected[programme]))),
hjust = 1, size = 2.3, colour = "#9b2367", fontface = "bold") +
geom_polygon(data = triangles, aes(x = x, y = y, group = leaf), fill = "#535353") +
geom_text(data = leaves, aes(x = x + 2, y = y, label = gbp(path_cost)), hjust = 0, size = 2.3,
colour = "#262626") +
scale_x_continuous(limits = c(0, 92)) +
scale_y_continuous(limits = c(-7.5, 7.5)) +
labs(title = paste("Diet advice has the lower expected cost, by about", gap, "GBP"),
subtitle = "Cost per patient of two fictitious programs; square: decision, circle: chance, triangle: outcome",
x = NULL, y = NULL,
caption = "Data: rdecision tutorial (Cognigni & Sims 2021)") +
theme_lex_viz(grid = "", arrows = "") +
theme(axis.text = element_blank())Sources (21)
69 occurrences dans le corpus; indexé par 1 ouvrage
Afficher les 21 sources
- Applied Multivariate Statistics in R
- Ault, Nam Liao & Musolino, Principles of Data Science, OpenStax, 2025
- Computational statistics in data science
- data-to-viz.com
- datawrapper.de↗
- Effective data visualization: the right chart for the right data
- Fiches de biostatistique du PBIL (Chessel, Dufour, Thioulouse et al., Lyon 1)
- From data to viz
- Information Graphics: A Comprehensive Illustrated Reference
- Information theory tools for visualization
- Living in data: a citizen's guide to a better information
- More Practical Charts
- Open Visualization Academy, cours et lettre d'information (Cairo et al.)
- Practical charts: the essential guide to creating clear, compelling charts for reports ...
- python-graph-gallery.com
- Rakotomalala, fascicules de cours de statistique (Université Lyon 2)
- Seeing with fresh eyes: meaning, space, data, truth
- The book of trees: visualizing branches of knowledge
- Wikipedia — Data and information visualization
- Wikipédia en français↗
- Wikipedia in English↗
Citer cette fiche
Adresse stablehttps://dataviz.adrientaudiere.com/terme/decision-tree.html
RéférenceTaudière Adrien. 2026. arbre de décision. Dans Visualization Vocabulary, version 1.0.0. IdEst. https://dataviz.adrientaudiere.com/terme/decision-tree.html
BibTeX
@incollection{taudiere2026-decision-tree,
  author    = {Taudière, Adrien},
  title     = {arbre de décision},
  booktitle = {Visualization Vocabulary},
  year      = {2026},
  version   = {1.0.0},
  publisher = {IdEst},
  url       = {https://dataviz.adrientaudiere.com/terme/decision-tree.html},
  note      = {CC0 1.0}
}Fiche créée le 09/11/2026. Texte modifié le 10/11/2026. Images modifiées le 12/11/2026. Chiffres calculés le 22/10/2026.