
 chart
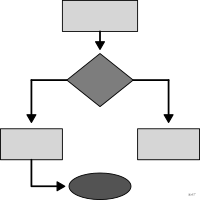
flow chart
also: flowchartDiagram of the steps and decisions of a process.
Classification
- chart
- networks and trees › schematic networks
- flow
Channels
 length; secondary: significance
 area; secondary: importance of the step
 spatial region; main: distance between nodes
 shape; main: type of step (rectangle, decision diamond)
Variants
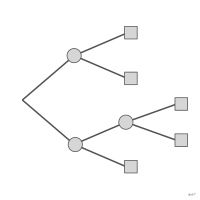 decision treeloop-free tree ending in outcomes
Attestation
- English definition: Brinton, Graphic Presentation, 1939↗
Scientific literature
OpenAlex: 46 286 papers since 1899, 30% in the last five years; mostly in Engineering, Medicine, Computer Science; Wikidata
Seminal references
- invention (1921) Gilbreth & Gilbreth (1921). Process charts: first steps in finding the one best way to do work. American Society of Mechanical Engineers; Wikipedia in English
R packages
- R
DiagrammeR::grViz(); GitHub 1 751 stars; last commit 2026-04 - R
flowchart::fc_draw(); GitHub 71 stars; last commit 2026-06
R code of the ggplot2 example
library(ggplot2)
library(dplyr)
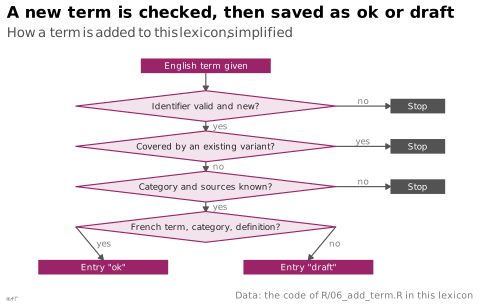
## How this lexicon's R/06_add_term.R adds a term: boxes for steps, diamonds
## for decisions, each decision answered by yes or no.
w <- 1.9 # half-width of a diamond
h <- 0.42 # half-height of a diamond
steps <- tribble(
~id, ~shape, ~x, ~y, ~label,
"start", "box", 0, 5.5, "English term given",
"id", "diamond", 0, 4.4, "Identifier valid and new?",
"variant", "diamond", 0, 3.3, "Covered by an existing variant?",
"registry", "diamond", 0, 2.2, "Category and sources known?",
"complete", "diamond", 0, 1.1, "French term, category, definition?",
"ok", "box", -1.5, 0, "Entry \"ok\"",
"draft", "box", 1.5, 0, "Entry \"draft\"",
"stop1", "stop", 3.1, 4.4, "Stop",
"stop2", "stop", 3.1, 3.3, "Stop",
"stop3", "stop", 3.1, 2.2, "Stop"
)
diamonds <- steps |>
filter(shape == "diamond") |>
rowwise() |>
reframe(id = id, x = x + c(0, w, 0, -w), y = y + c(h, 0, -h, 0))
boxes <- filter(steps, shape != "diamond")
arrows <- tribble(
~x, ~y, ~xend, ~yend, ~answer,
0, 5.3, 0, 4.4 + h, "",
0, 4.4 - h, 0, 3.3 + h, "yes",
w, 4.4, 2.7, 4.4, "no",
0, 3.3 - h, 0, 2.2 + h, "no",
w, 3.3, 2.7, 3.3, "yes",
0, 2.2 - h, 0, 1.1 + h, "yes",
w, 2.2, 2.7, 2.2, "no",
-w, 1.1, -1.5, 0.2, "yes",
w, 1.1, 1.5, 0.2, "no"
)
p <- ggplot() +
geom_segment(data = arrows, aes(x = x, y = y, xend = xend, yend = yend), colour = "#535353",
linewidth = 0.4, arrow = grid::arrow(length = unit(1.4, "mm"), type = "closed")) +
geom_text(data = filter(arrows, answer != ""),
aes(x = (x + xend) / 2 + ifelse(y == yend, 0, 0.1), y = (y + yend) / 2 + ifelse(y == yend, 0.14, 0),
label = answer, hjust = ifelse(y == yend, 0.5, 0)), size = 2.3, colour = "#7d7d7d") +
geom_polygon(data = diamonds, aes(x = x, y = y, group = id), fill = "#f3e3ec", colour = "#9b2367", linewidth = 0.4) +
geom_tile(data = boxes, aes(x = x, y = y, width = ifelse(shape == "stop", 0.8, 1.9), height = 0.4,
fill = shape), colour = NA) +
geom_text(data = steps, aes(x = x, y = y, label = label,
colour = ifelse(shape == "diamond", "dark", "light")), size = 2.3) +
scale_fill_manual(values = c(box = "#9b2367", stop = "#535353"), guide = "none") +
scale_colour_manual(values = c(dark = "#262626", light = "white"), guide = "none") +
scale_x_continuous(limits = c(-2.6, 3.6)) +
labs(title = "A new term is checked, then saved as ok or draft",
subtitle = "How a term is added to this lexicon, simplified",
x = NULL, y = NULL,
caption = "Data: the code of R/06_add_term.R in this lexicon") +
theme_lex_viz(grid = "", arrows = "") +
theme(axis.text = element_blank())Sources (34)
131 occurrences in the corpus; indexed by 7 books
Show the 34 sources
- 100 diagrams that changed the world: from the earliest cave paintings to the innovation...
- app.flourish.studio
- Applied Multivariate Statistics in R
- Atlas of knowledge: anyone can map
- Ault, Nam Liao & Musolino, Principles of Data Science, OpenStax, 2025
- Beautiful evidence
- Better data visualizations: a guide for scholars, researchers, and wonks
- Brinton, Graphic Presentation, 1939↗
- Building Science Graphics: An Illustrated Guide to Communicating Science through Diagra...
- Cartographies of Time
- Cartography: thematic map design
- Data Feminism
- Data points: visualization that means something
- Data sketches
- Data Visualisation Guide, data.europa.eu
- Data visualization handbook
- Data Viz Project
- Data-driven storytelling
- dataphys.org
- datavizproject.com
- Effective data storytelling: how to drive change with data, narrative, and visuals
- Exploratory Data Analysis: Descriptive Analysis, Visualization, and Dashboard Design (w...
- Graphic presentation
- Graphics for learning: proven guidelines for planning, designing, and evaluating visual...
- Information graphics
- Information Graphics: A Comprehensive Illustrated Reference
- Semiology of graphics: diagrams, networks, maps
- The Truthful Art: Data, Charts, and Maps for Communication
- The Wall Street journal guide to information graphics: the dos and don'ts of presenting...
- Thematic Cartography and Geovisualization
- Visual complexity: mapping patterns of information
- Visual strategies for biological data
- Visualize This
- Wikipedia in English↗
Cite this entry
Stable addresshttps://dataviz.adrientaudiere.com/en-only/term/flow-chart.html
ReferenceTaudière Adrien. 2026. flow chart. In Visualization Vocabulary, version 1.0.0. IdEst. https://dataviz.adrientaudiere.com/en-only/term/flow-chart.html
BibTeX
@incollection{taudiere2026-flow-chart,
  author    = {Taudière, Adrien},
  title     = {flow chart},
  booktitle = {Visualization Vocabulary},
  year      = {2026},
  version   = {1.0.0},
  publisher = {IdEst},
  url       = {https://dataviz.adrientaudiere.com/en-only/term/flow-chart.html},
  note      = {CC0 1.0}
}Page created on 2026-10-13. Text last changed on 2026-11-09. Images last changed on 2026-11-09. Numbers computed on 2026-10-22.