
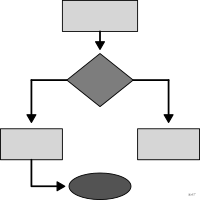
 graphique
organigramme
aussi : logigrammeSchéma des étapes et décisions d'un processus.
flow chart
also: flowchartDiagram of the steps and decisions of a process.
« Organigramme » désigne aussi l'organisation d'une équipe.
Classification
- graphique
- réseaux et arbres › réseaux schématiques
- flux
Canaux
 longueur; secondaire : significativité
 aire; secondaire : importance de l'étape
 région de l'espace; principal : distance entre les nœuds
 forme; principal : nature de l'étape (rectangle, losange de décision)
Variantes
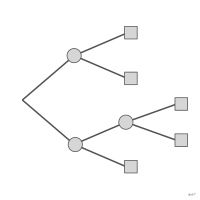 arbre de décisionarbre sans boucle menant à des issues
Attestation et synonymies
- terme français : Andry, Kieffer & Lambotte, Les fondamentaux de la visualisation de données, De Boeck, 2022
- définition anglaise : Brinton, Graphic Presentation, 1939↗
- organigramme de programmation; Wikipédia en français↗
Littérature scientifique
OpenAlex : 46 286 articles depuis 1899, dont 30 % ces cinq dernières années; surtout en Engineering, Medicine, Computer Science; Wikidata
Références séminales
- invention (1921) Gilbreth & Gilbreth (1921). Process charts: first steps in finding the one best way to do work. American Society of Mechanical Engineers; Wikipedia in English
Paquets R
- R
DiagrammeR::grViz(); GitHub 1 751 étoiles; dernier commit 2026-04 - R
flowchart::fc_draw(); GitHub 71 étoiles; dernier commit 2026-06
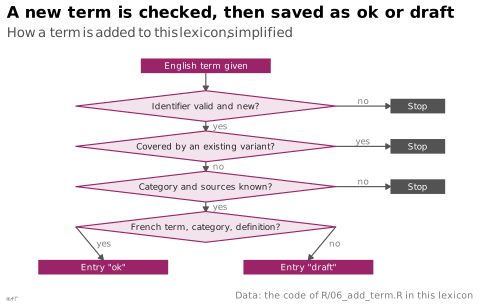
Code R de l'exemple ggplot2
library(ggplot2)
library(dplyr)
## How this lexicon's R/06_add_term.R adds a term: boxes for steps, diamonds
## for decisions, each decision answered by yes or no.
w <- 1.9 # half-width of a diamond
h <- 0.42 # half-height of a diamond
steps <- tribble(
~id, ~shape, ~x, ~y, ~label,
"start", "box", 0, 5.5, "English term given",
"id", "diamond", 0, 4.4, "Identifier valid and new?",
"variant", "diamond", 0, 3.3, "Covered by an existing variant?",
"registry", "diamond", 0, 2.2, "Category and sources known?",
"complete", "diamond", 0, 1.1, "French term, category, definition?",
"ok", "box", -1.5, 0, "Entry \"ok\"",
"draft", "box", 1.5, 0, "Entry \"draft\"",
"stop1", "stop", 3.1, 4.4, "Stop",
"stop2", "stop", 3.1, 3.3, "Stop",
"stop3", "stop", 3.1, 2.2, "Stop"
)
diamonds <- steps |>
filter(shape == "diamond") |>
rowwise() |>
reframe(id = id, x = x + c(0, w, 0, -w), y = y + c(h, 0, -h, 0))
boxes <- filter(steps, shape != "diamond")
arrows <- tribble(
~x, ~y, ~xend, ~yend, ~answer,
0, 5.3, 0, 4.4 + h, "",
0, 4.4 - h, 0, 3.3 + h, "yes",
w, 4.4, 2.7, 4.4, "no",
0, 3.3 - h, 0, 2.2 + h, "no",
w, 3.3, 2.7, 3.3, "yes",
0, 2.2 - h, 0, 1.1 + h, "yes",
w, 2.2, 2.7, 2.2, "no",
-w, 1.1, -1.5, 0.2, "yes",
w, 1.1, 1.5, 0.2, "no"
)
p <- ggplot() +
geom_segment(data = arrows, aes(x = x, y = y, xend = xend, yend = yend), colour = "#535353",
linewidth = 0.4, arrow = grid::arrow(length = unit(1.4, "mm"), type = "closed")) +
geom_text(data = filter(arrows, answer != ""),
aes(x = (x + xend) / 2 + ifelse(y == yend, 0, 0.1), y = (y + yend) / 2 + ifelse(y == yend, 0.14, 0),
label = answer, hjust = ifelse(y == yend, 0.5, 0)), size = 2.3, colour = "#7d7d7d") +
geom_polygon(data = diamonds, aes(x = x, y = y, group = id), fill = "#f3e3ec", colour = "#9b2367", linewidth = 0.4) +
geom_tile(data = boxes, aes(x = x, y = y, width = ifelse(shape == "stop", 0.8, 1.9), height = 0.4,
fill = shape), colour = NA) +
geom_text(data = steps, aes(x = x, y = y, label = label,
colour = ifelse(shape == "diamond", "dark", "light")), size = 2.3) +
scale_fill_manual(values = c(box = "#9b2367", stop = "#535353"), guide = "none") +
scale_colour_manual(values = c(dark = "#262626", light = "white"), guide = "none") +
scale_x_continuous(limits = c(-2.6, 3.6)) +
labs(title = "A new term is checked, then saved as ok or draft",
subtitle = "How a term is added to this lexicon, simplified",
x = NULL, y = NULL,
caption = "Data: the code of R/06_add_term.R in this lexicon") +
theme_lex_viz(grid = "", arrows = "") +
theme(axis.text = element_blank())Sources (38)
131 occurrences dans le corpus; indexé par 7 ouvrages
Afficher les 38 sources
- 100 diagrams that changed the world: from the earliest cave paintings to the innovation...
- Andry, Kieffer & Lambotte, Les fondamentaux de la visualisation de données, De Boeck, 2022
- app.flourish.studio
- Applied Multivariate Statistics in R
- Atlas of knowledge: anyone can map
- Ault, Nam Liao & Musolino, Principles of Data Science, OpenStax, 2025
- Beautiful evidence
- Better data visualizations: a guide for scholars, researchers, and wonks
- Brinton, Graphic Presentation, 1939↗
- Building Science Graphics: An Illustrated Guide to Communicating Science through Diagra...
- Cartographies of Time
- Cartography: thematic map design
- Data Feminism
- Data points: visualization that means something
- Data sketches
- Data Visualisation Guide, data.europa.eu
- Data visualization handbook
- Data Viz Project
- Data-driven storytelling
- dataphys.org
- datavizproject.com
- Effective data storytelling: how to drive change with data, narrative, and visuals
- Exploratory Data Analysis: Descriptive Analysis, Visualization, and Dashboard Design (w...
- Graphic presentation
- Graphics for learning: proven guidelines for planning, designing, and evaluating visual...
- Information graphics
- Information Graphics: A Comprehensive Illustrated Reference
- La graphique et le traitement graphique de l'information
- Les fondamentaux de la visualisation de données
- Semiology of graphics: diagrams, networks, maps
- The Truthful Art: Data, Charts, and Maps for Communication
- The Wall Street journal guide to information graphics: the dos and don'ts of presenting...
- Thematic Cartography and Geovisualization
- Visual complexity: mapping patterns of information
- Visual strategies for biological data
- Visualize This
- Wikipédia en français↗
- Wikipedia in English↗
Citer cette fiche
Adresse stablehttps://dataviz.adrientaudiere.com/terme/flow-chart.html
RéférenceTaudière Adrien. 2026. organigramme. Dans Visualization Vocabulary, version 1.0.0. IdEst. https://dataviz.adrientaudiere.com/terme/flow-chart.html
BibTeX
@incollection{taudiere2026-flow-chart,
  author    = {Taudière, Adrien},
  title     = {organigramme},
  booktitle = {Visualization Vocabulary},
  year      = {2026},
  version   = {1.0.0},
  publisher = {IdEst},
  url       = {https://dataviz.adrientaudiere.com/terme/flow-chart.html},
  note      = {CC0 1.0}
}Fiche créée le 13/10/2026. Texte modifié le 09/11/2026. Images modifiées le 09/11/2026. Chiffres calculés le 22/10/2026.