
 chart
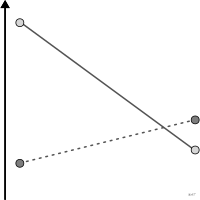
interaction plot
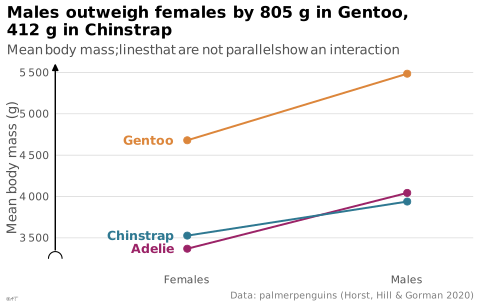
Effect of one factor drawn separately for each level of another.
Classification
- chart
- lines and areas › lines
- correlation
Channels
 position on common scale; main: mean
 tilt/angle; main: effect of the first factor (different slopes signal the interaction)
 color hue; main: level of the second factor
 shape; secondary: level of the second factor
Scientific literature
OpenAlex: 889 papers since 1990, 49% in the last five years; mostly in Engineering, Chemistry, Medicine
R code of the ggplot2 example
library(ggplot2)
library(dplyr)
library(palmerpenguins)
means <- penguins |>
filter(!is.na(sex)) |>
group_by(species, sex) |>
summarise(mass = mean(body_mass_g), .groups = "drop")
p <- ggplot(means, aes(x = sex, y = mass, colour = species, group = species)) +
geom_line(linewidth = 0.7) +
geom_point(size = 2.2) +
geom_text(data = filter(means, sex == "female"), aes(label = species),
hjust = 1, nudge_x = -0.06, size = 3.3, fontface = "bold") +
scale_x_discrete(labels = c(female = "Females", male = "Males"), expand = expansion(add = c(0.6, 0.3))) +
scale_y_continuous(labels = lex_number, breaks = lex_break_breaks, expand = lex_break_expand) +
labs(title = "Males outweigh females by 805 g in Gentoo,\n412 g in Chinstrap",
subtitle = "Mean body mass; lines that are not parallel show an interaction",
x = NULL, y = "Mean body mass (g)",
caption = "Data: palmerpenguins (Horst, Hill & Gorman 2020)") +
theme_lex_viz(grid = "y", arrows = "y", break_not_zero = "y") +
theme(legend.position = "none")Cite this entry
Stable addresshttps://dataviz.adrientaudiere.com/en-only/term/interaction-plot.html
ReferenceTaudière Adrien. 2026. interaction plot. In Visualization Vocabulary, version 1.0.0. IdEst. https://dataviz.adrientaudiere.com/en-only/term/interaction-plot.html
BibTeX
@incollection{taudiere2026-interaction-plot,
  author    = {Taudière, Adrien},
  title     = {interaction plot},
  booktitle = {Visualization Vocabulary},
  year      = {2026},
  version   = {1.0.0},
  publisher = {IdEst},
  url       = {https://dataviz.adrientaudiere.com/en-only/term/interaction-plot.html},
  note      = {CC0 1.0}
}Page created on 2026-10-13. Text last changed on 2026-10-22. Images last changed on 2026-11-12. Numbers computed on 2026-10-22.