
 graphique
 d'interaction
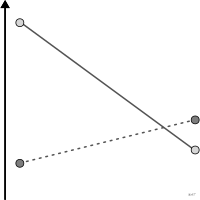
Effet d'un facteur tracé séparément pour chaque niveau d'un autre.
interaction plot
Effect of one factor drawn separately for each level of another.
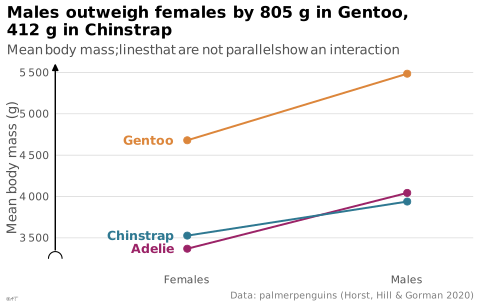
Des droites non parallèles signalent une interaction. Vérifié : absent du corpus book_dataviz et des sources en ligne — c'est un terme de plan d'expérience statistique (stats::interaction.plot en R base) plutôt que de dataviz.
Classification
- graphique
- courbes et aires › courbes
- corrélation
Canaux
 position sur une échelle commune; principal : moyenne
 inclinaison ou angle; principal : effet du premier facteur (des pentes différentes signalent l'interaction)
 teinte; principal : niveau du second facteur
 forme; secondaire : niveau du second facteur
Attestation
- terme français : Usage courant, non attesté par une source
Littérature scientifique
OpenAlex : 889 articles depuis 1990, dont 49 % ces cinq dernières années; surtout en Engineering, Chemistry, Medicine
Code R de l'exemple ggplot2
library(ggplot2)
library(dplyr)
library(palmerpenguins)
means <- penguins |>
filter(!is.na(sex)) |>
group_by(species, sex) |>
summarise(mass = mean(body_mass_g), .groups = "drop")
p <- ggplot(means, aes(x = sex, y = mass, colour = species, group = species)) +
geom_line(linewidth = 0.7) +
geom_point(size = 2.2) +
geom_text(data = filter(means, sex == "female"), aes(label = species),
hjust = 1, nudge_x = -0.06, size = 3.3, fontface = "bold") +
scale_x_discrete(labels = c(female = "Females", male = "Males"), expand = expansion(add = c(0.6, 0.3))) +
scale_y_continuous(labels = lex_number, breaks = lex_break_breaks, expand = lex_break_expand) +
labs(title = "Males outweigh females by 805 g in Gentoo,\n412 g in Chinstrap",
subtitle = "Mean body mass; lines that are not parallel show an interaction",
x = NULL, y = "Mean body mass (g)",
caption = "Data: palmerpenguins (Horst, Hill & Gorman 2020)") +
theme_lex_viz(grid = "y", arrows = "y", break_not_zero = "y") +
theme(legend.position = "none")Citer cette fiche
Adresse stablehttps://dataviz.adrientaudiere.com/terme/interaction-plot.html
RéférenceTaudière Adrien. 2026. graphique d'interaction. Dans Visualization Vocabulary, version 1.0.0. IdEst. https://dataviz.adrientaudiere.com/terme/interaction-plot.html
BibTeX
@incollection{taudiere2026-interaction-plot,
  author    = {Taudière, Adrien},
  title     = {graphique d'interaction},
  booktitle = {Visualization Vocabulary},
  year      = {2026},
  version   = {1.0.0},
  publisher = {IdEst},
  url       = {https://dataviz.adrientaudiere.com/terme/interaction-plot.html},
  note      = {CC0 1.0}
}Fiche créée le 13/10/2026. Texte modifié le 22/10/2026. Images modifiées le 12/11/2026. Chiffres calculés le 22/10/2026.