
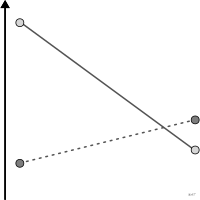
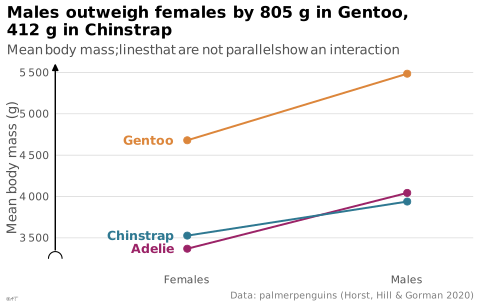
 chart
interaction plot
Effect of one factor drawn separately for each level of another.
graphique d'interaction
Effet d'un facteur tracé séparément pour chaque niveau d'un autre.
Des droites non parallèles signalent une interaction. Vérifié : absent du corpus book_dataviz et des sources en ligne — c'est un terme de plan d'expérience statistique (stats::interaction.plot en R base) plutôt que de dataviz.
Classification
- chart
- lines and areas › lines
- correlation
Channels
 position on common scale; main: mean
 tilt/angle; main: effect of the first factor (different slopes signal the interaction)
 color hue; main: level of the second factor
 shape; secondary: level of the second factor
Attestation
- French term: Common usage, not attested by a source
Scientific literature
OpenAlex: 889 papers since 1990, 49% in the last five years; mostly in Engineering, Chemistry, Medicine
R code of the ggplot2 example
library(ggplot2)
library(dplyr)
library(palmerpenguins)
means <- penguins |>
filter(!is.na(sex)) |>
group_by(species, sex) |>
summarise(mass = mean(body_mass_g), .groups = "drop")
p <- ggplot(means, aes(x = sex, y = mass, colour = species, group = species)) +
geom_line(linewidth = 0.7) +
geom_point(size = 2.2) +
geom_text(data = filter(means, sex == "female"), aes(label = species),
hjust = 1, nudge_x = -0.06, size = 3.3, fontface = "bold") +
scale_x_discrete(labels = c(female = "Females", male = "Males"), expand = expansion(add = c(0.6, 0.3))) +
scale_y_continuous(labels = lex_number, breaks = lex_break_breaks, expand = lex_break_expand) +
labs(title = "Males outweigh females by 805 g in Gentoo,\n412 g in Chinstrap",
subtitle = "Mean body mass; lines that are not parallel show an interaction",
x = NULL, y = "Mean body mass (g)",
caption = "Data: palmerpenguins (Horst, Hill & Gorman 2020)") +
theme_lex_viz(grid = "y", arrows = "y", break_not_zero = "y") +
theme(legend.position = "none")Cite this entry
Stable addresshttps://dataviz.adrientaudiere.com/en/term/interaction-plot.html
ReferenceTaudière Adrien. 2026. interaction plot. In Visualization Vocabulary, version 1.0.0. IdEst. https://dataviz.adrientaudiere.com/en/term/interaction-plot.html
BibTeX
@incollection{taudiere2026-interaction-plot,
  author    = {Taudière, Adrien},
  title     = {interaction plot},
  booktitle = {Visualization Vocabulary},
  year      = {2026},
  version   = {1.0.0},
  publisher = {IdEst},
  url       = {https://dataviz.adrientaudiere.com/en/term/interaction-plot.html},
  note      = {CC0 1.0}
}Page created on 2026-10-13. Text last changed on 2026-10-22. Images last changed on 2026-11-12. Numbers computed on 2026-10-22.