

 chart
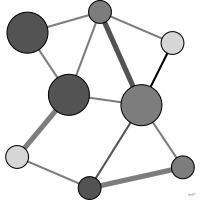
network diagram
also: node-link diagramNodes joined by links representing relationships.
Classification
- chart
- networks and trees › general networks
- flow; Financial Times Visual Vocabulary
Channels
 length; secondary: distance between nodes; Munzner 2014
 area; secondary: node degree or weight; Munzner 2014
 color luminance; secondary: link weight; Munzner 2014
 color saturation; secondary: link weight (instead of luminance)
 color hue; secondary: group of nodes; Munzner 2014
 shape; secondary: group of nodes; Munzner 2014
Variants
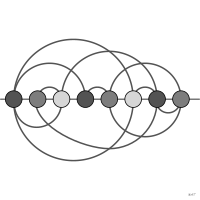 arc diagramlinear layout
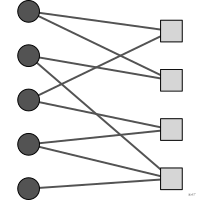 bipartite networktwo node sets
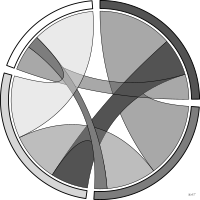 chord diagramcircular layout
- hive plotnodes on radial axes
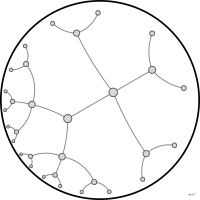 hyperbolic treetree in hyperbolic geometry
Scientific literature
OpenAlex: 3 794 papers since 1963, 40% in the last five years; mostly in Computer Science, Decision Sciences, Medicine
Seminal references
- first known use (1934) Moreno (1934). Who Shall Survive?; Ciuccarelli 2026
R packages
- R
ggraph::ggraph(); GitHub 1 121 stars; last commit 2025-08
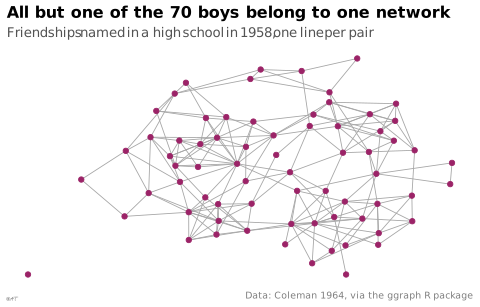
R code of the ggplot2 example
library(ggplot2)
library(dplyr)
library(igraph)
library(ggraph)
## Friendships named in 1958, one tie per pair whoever named whom.
boys <- sort(unique(c(highschool$from, highschool$to)))
ties <- highschool |>
filter(year == 1958) |>
select(from, to)
friends <- graph_from_data_frame(ties, vertices = data.frame(name = boys)) |>
as_undirected(mode = "collapse")
set.seed(1)
p <- ggraph(friends, layout = "stress") +
geom_edge_link(colour = "#a6a6a6", width = 0.3) +
geom_node_point(size = 1.6, colour = "#9b2367") +
labs(title = "All but one of the 70 boys belong to one network",
subtitle = "Friendships named in a high school in 1958, one line per pair",
caption = "Data: Coleman 1964, via the ggraph R package") +
theme_lex_viz(grid = "", arrows = "") +
theme(axis.text = element_blank(), axis.title = element_blank())Sources (23)
92 occurrences in the corpus; indexed by 8 books
Show the 23 sources
- Atlas of knowledge: anyone can map
- Ault, Nam Liao & Musolino, Principles of Data Science, OpenStax, 2025
- Better data visualizations: a guide for scholars, researchers, and wonks
- Bremer & Barone, Chart, CRC Press, 2025
- Building Science Graphics: An Illustrated Guide to Communicating Science through Diagra...
- Data visualisation: a handbook for data driven design
- Data visualization handbook
- Design for information: an introduction to the histories, theories, and best practices ...
- Effective data visualization: the right chart for the right data
- Exploratory Data Analysis: Descriptive Analysis, Visualization, and Dashboard Design (w...
- How maps work: representation, visualization, and design
- Information Graphics: A Comprehensive Illustrated Reference
- Interactive data visualization: foundations, techniques, and applications
- Open Visualization Academy, courses and newsletter (Cairo et al.)
- The book of circles: visualizing spheres of knowledge
- The book of trees: visualizing branches of knowledge
- The elements of graphing data
- The golden age of data visualization: how did we get here?
- Visual complexity: mapping patterns of information
- Visual strategies for biological data
- Visualization Analysis and Design
- Visualization of Time-Oriented Data
- Wikipedia in English↗
Cite this entry
Stable addresshttps://dataviz.adrientaudiere.com/en-only/term/network-diagram.html
ReferenceTaudière Adrien. 2026. network diagram. In Visualization Vocabulary, version 1.0.0. IdEst. https://dataviz.adrientaudiere.com/en-only/term/network-diagram.html
BibTeX
@incollection{taudiere2026-network-diagram,
  author    = {Taudière, Adrien},
  title     = {network diagram},
  booktitle = {Visualization Vocabulary},
  year      = {2026},
  version   = {1.0.0},
  publisher = {IdEst},
  url       = {https://dataviz.adrientaudiere.com/en-only/term/network-diagram.html},
  note      = {CC0 1.0}
}Page created on 2026-10-13. Text last changed on 2026-11-02. Images last changed on 2026-11-09. Numbers computed on 2026-10-22.