
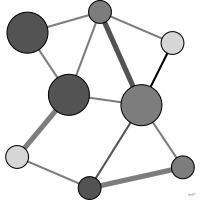

 graphique
graphe
aussi : diagramme nœuds-liensNœuds reliés par des liens représentant des relations.
network diagram
also: node-link diagramNodes joined by links representing relationships.
Cas particulier du réseau au sens de Bertin, dont les correspondances portent sur une seule composante.
Classification
- graphique
- réseaux et arbres › réseaux quelconques
- flux; Visual Vocabulary du Financial Times
Canaux
 longueur; secondaire : distance entre les nœuds; Munzner 2014
 aire; secondaire : degré ou poids du nœud; Munzner 2014
 luminance; secondaire : poids du lien; Munzner 2014
 saturation; secondaire : poids du lien (à la place de la luminance)
 teinte; secondaire : groupe de nœuds; Munzner 2014
 forme; secondaire : groupe de nœuds; Munzner 2014
Variantes
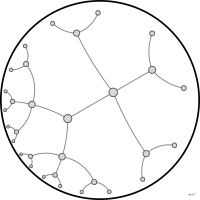 arbre hyperboliquearbre en géométrie hyperbolique
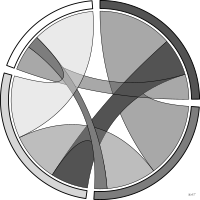 diagramme en accordsdisposition circulaire
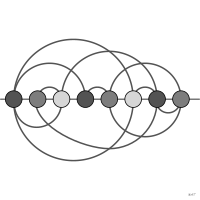 diagramme en arcnœuds alignés
- hive plotnœuds sur des axes rayonnants
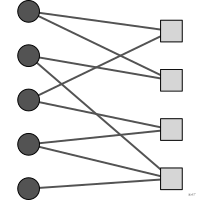 réseau bipartitedeux ensembles de nœuds
Attestation et synonymies
- terme français : Bertin, Sémiologie graphique, 1967
Littérature scientifique
OpenAlex : 3 794 articles depuis 1963, dont 40 % ces cinq dernières années; surtout en Computer Science, Decision Sciences, Medicine
Références séminales
- premier usage connu (1934) Moreno (1934). Who Shall Survive?; Ciuccarelli 2026
Paquets R
- R
ggraph::ggraph(); GitHub 1 121 étoiles; dernier commit 2025-08
Code R de l'exemple ggplot2
library(ggplot2)
library(dplyr)
library(igraph)
library(ggraph)
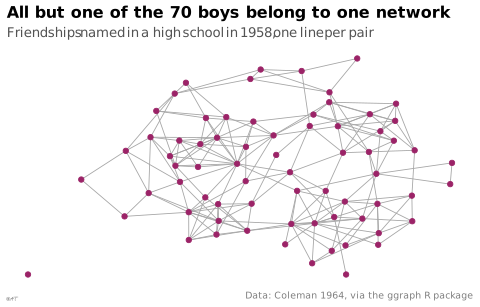
## Friendships named in 1958, one tie per pair whoever named whom.
boys <- sort(unique(c(highschool$from, highschool$to)))
ties <- highschool |>
filter(year == 1958) |>
select(from, to)
friends <- graph_from_data_frame(ties, vertices = data.frame(name = boys)) |>
as_undirected(mode = "collapse")
set.seed(1)
p <- ggraph(friends, layout = "stress") +
geom_edge_link(colour = "#a6a6a6", width = 0.3) +
geom_node_point(size = 1.6, colour = "#9b2367") +
labs(title = "All but one of the 70 boys belong to one network",
subtitle = "Friendships named in a high school in 1958, one line per pair",
caption = "Data: Coleman 1964, via the ggraph R package") +
theme_lex_viz(grid = "", arrows = "") +
theme(axis.text = element_blank(), axis.title = element_blank())Sources (36)
92 occurrences dans le corpus; indexé par 8 ouvrages
Afficher les 36 sources
- Atlas of knowledge: anyone can map
- Ault, Nam Liao & Musolino, Principles of Data Science, OpenStax, 2025
- Bertin, Sémiologie graphique, 1967
- Better data visualizations: a guide for scholars, researchers, and wonks
- Bremer & Barone, Chart, CRC Press, 2025
- Building Science Graphics: An Illustrated Guide to Communicating Science through Diagra...
- Data visualisation: a handbook for data driven design
- Data visualization handbook
- Dehaene, « La perception des graphiques : un nouvel exemple de recyclage neuronal », cours au Collège de France, 2025↗
- Design for information: an introduction to the histories, theories, and best practices ...
- Effective data visualization: the right chart for the right data
- Exploratory Data Analysis: Descriptive Analysis, Visualization, and Dashboard Design (w...
- Fiches de biostatistique du PBIL (Chessel, Dufour, Thioulouse et al., Lyon 1)
- Grosjean & Engels, Science des données biologiques I-III (Université de Mons)
- How maps work: representation, visualization, and design
- Information Graphics: A Comprehensive Illustrated Reference
- Interactive data visualization: foundations, techniques, and applications
- Larmarange et al., analyse-R : introduction à l'analyse d'enquêtes avec R
- Les fondamentaux de la visualisation de données
- Manuel de datavisualisation - 2e éd, vol. 2
- Open Visualization Academy, cours et lettre d'information (Cairo et al.)
- Règles pour l'accessibilité des contenus Web (WCAG) 2.1, traduction française autorisée (W3C)
- RGAA, référentiel général d'amélioration de l'accessibilité : glossaire, critères et tests
- Série d'ateliers R du CSBQ, version française (Centre de la science de la biodiversité du Québec)
- The book of circles: visualizing spheres of knowledge
- The book of trees: visualizing branches of knowledge
- The elements of graphing data
- The golden age of data visualization: how did we get here?
- utilitR, documentation collaborative sur R (Insee)
- Visual complexity: mapping patterns of information
- Visual strategies for biological data
- Visualization Analysis and Design
- Visualization of Time-Oriented Data
- Wikipédia — Visualisation de données
- Wikipédia en français↗
- Wikipedia in English↗
Citer cette fiche
Adresse stablehttps://dataviz.adrientaudiere.com/terme/network-diagram.html
RéférenceTaudière Adrien. 2026. graphe. Dans Visualization Vocabulary, version 1.0.0. IdEst. https://dataviz.adrientaudiere.com/terme/network-diagram.html
BibTeX
@incollection{taudiere2026-network-diagram,
  author    = {Taudière, Adrien},
  title     = {graphe},
  booktitle = {Visualization Vocabulary},
  year      = {2026},
  version   = {1.0.0},
  publisher = {IdEst},
  url       = {https://dataviz.adrientaudiere.com/terme/network-diagram.html},
  note      = {CC0 1.0}
}Fiche créée le 13/10/2026. Texte modifié le 02/11/2026. Images modifiées le 09/11/2026. Chiffres calculés le 22/10/2026.