
 chart
sina plot
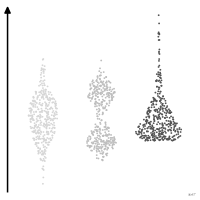
Points of a distribution spread sideways in proportion to local density.
Classification
- chart
- points and bubbles › dot strips
- distribution
Channels
 position on common scale; main: value
 length; secondary: local density (sideways spread)
 area; secondary: total density (the total density is often scaled to 1 for every group)
 spatial region; main: group
Attestation
- English definition: Wilke, Fundamentals of Data Visualization, O'Reilly, 2019
Scientific literature
OpenAlex: 15 papers since 2024, 73% in the last five years; mostly in Computer Science, Decision Sciences, Engineering; Wikidata
Seminal references
R packages
- R
ggforce::geom_sina(); GitHub 958 stars; last commit 2025-09 - R
sinaplot::sinaplot(); paper (1 citations)
R code of the ggplot2 example
set.seed(20261015)
library(ggplot2)
library(ggforce)
library(dplyr)
library(datarium)
## Cleveland, the most complete of the four sites. `num` grades the narrowing
## of the arteries from 0 (none) to 4; above 0, the disease is present.
cleveland <- heartdisease |>
filter(dataset == "cleveland") |>
mutate(disease = factor(num > 0, levels = c(FALSE, TRUE), labels = c("No disease", "Heart disease")))
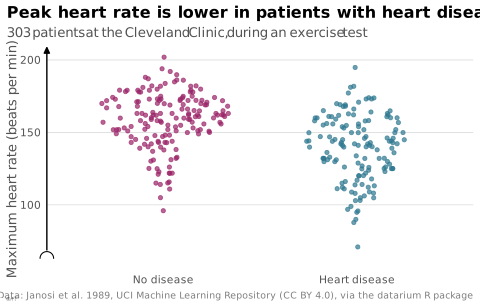
p <- ggplot(cleveland, aes(x = disease, y = thalach, colour = disease)) +
geom_sina(size = 1.2, alpha = 0.7, maxwidth = 0.7) +
scale_y_continuous(labels = lex_number, breaks = lex_break_breaks, expand = lex_break_expand) +
labs(title = "Peak heart rate is lower in patients with heart disease",
subtitle = "303 patients at the Cleveland Clinic, during an exercise test",
x = NULL, y = "Maximum heart rate (beats per min)",
caption = "Data: Janosi et al. 1989, UCI Machine Learning Repository (CC BY 4.0), via the datarium R package") +
theme_lex_viz(grid = "y", arrows = "y", break_not_zero = "y") +
theme(legend.position = "none")Sources (2)
Cite this entry
Stable addresshttps://dataviz.adrientaudiere.com/en-only/term/sina-plot.html
ReferenceTaudière Adrien. 2026. sina plot. In Visualization Vocabulary, version 1.0.0. IdEst. https://dataviz.adrientaudiere.com/en-only/term/sina-plot.html
BibTeX
@incollection{taudiere2026-sina-plot,
  author    = {Taudière, Adrien},
  title     = {sina plot},
  booktitle = {Visualization Vocabulary},
  year      = {2026},
  version   = {1.0.0},
  publisher = {IdEst},
  url       = {https://dataviz.adrientaudiere.com/en-only/term/sina-plot.html},
  note      = {CC0 1.0}
}Page created on 2026-10-13. Text last changed on 2026-10-22. Images last changed on 2026-11-12. Numbers computed on 2026-10-22.