
 chart
sina plot
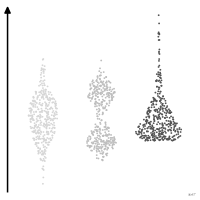
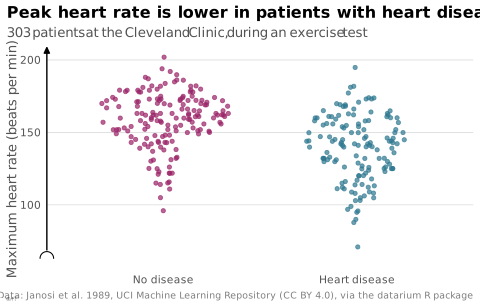
Points of a distribution spread sideways in proportion to local density.
sina plot
Points d'une distribution écartés latéralement en proportion de la densité locale.
Hybride du diagramme en violon et des points bruités (Sidiropoulos et al. 2018) : chaque observation reste visible.
Classification
- chart
- points and bubbles › dot strips
- distribution
Channels
 position on common scale; main: value
 length; secondary: local density (sideways spread)
 area; secondary: total density (the total density is often scaled to 1 for every group)
 spatial region; main: group
Attestation
- French term: Common usage, not attested by a source
- English definition: Wilke, Fundamentals of Data Visualization, O'Reilly, 2019
Scientific literature
OpenAlex: 15 papers since 2024, 73% in the last five years; mostly in Computer Science, Decision Sciences, Engineering; Wikidata
Seminal references
R packages
- R
ggforce::geom_sina(); GitHub 958 stars; last commit 2025-09 - R
sinaplot::sinaplot(); paper (1 citations)
R code of the ggplot2 example
set.seed(20261015)
library(ggplot2)
library(ggforce)
library(dplyr)
library(datarium)
## Cleveland, the most complete of the four sites. `num` grades the narrowing
## of the arteries from 0 (none) to 4; above 0, the disease is present.
cleveland <- heartdisease |>
filter(dataset == "cleveland") |>
mutate(disease = factor(num > 0, levels = c(FALSE, TRUE), labels = c("No disease", "Heart disease")))
p <- ggplot(cleveland, aes(x = disease, y = thalach, colour = disease)) +
geom_sina(size = 1.2, alpha = 0.7, maxwidth = 0.7) +
scale_y_continuous(labels = lex_number, breaks = lex_break_breaks, expand = lex_break_expand) +
labs(title = "Peak heart rate is lower in patients with heart disease",
subtitle = "303 patients at the Cleveland Clinic, during an exercise test",
x = NULL, y = "Maximum heart rate (beats per min)",
caption = "Data: Janosi et al. 1989, UCI Machine Learning Repository (CC BY 4.0), via the datarium R package") +
theme_lex_viz(grid = "y", arrows = "y", break_not_zero = "y") +
theme(legend.position = "none")Sources (2)
Cite this entry
Stable addresshttps://dataviz.adrientaudiere.com/en/term/sina-plot.html
ReferenceTaudière Adrien. 2026. sina plot. In Visualization Vocabulary, version 1.0.0. IdEst. https://dataviz.adrientaudiere.com/en/term/sina-plot.html
BibTeX
@incollection{taudiere2026-sina-plot,
  author    = {Taudière, Adrien},
  title     = {sina plot},
  booktitle = {Visualization Vocabulary},
  year      = {2026},
  version   = {1.0.0},
  publisher = {IdEst},
  url       = {https://dataviz.adrientaudiere.com/en/term/sina-plot.html},
  note      = {CC0 1.0}
}Page created on 2026-10-13. Text last changed on 2026-10-22. Images last changed on 2026-11-12. Numbers computed on 2026-10-22.