
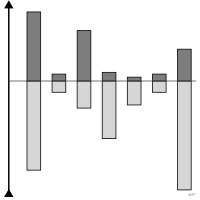
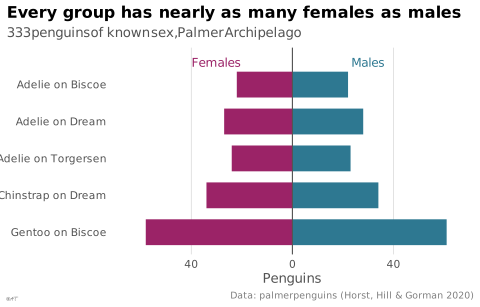
 chart
spine chart
also: spineSingle value split into two opposed components either side of an axis.
Classification
- chart
- bars › diverging bars
- deviation; Financial Times Visual Vocabulary
- the name evokes: nature
Channels
 position on common scale; secondary: total on each side of the axis
 length; main: share of each component
 spatial region; main: component, on each side of the axis
 color hue; secondary: component
Attestation
- English definition: Financial Times Visual Vocabulary
Scientific literature
OpenAlex: 3 papers since 2026, 33% in the last five years; mostly in Medicine, Mathematics
R code of the ggplot2 example
library(ggplot2)
library(dplyr)
library(palmerpenguins)
## Each group split on either side of the spine: females left, males right.
sexes <- penguins |>
filter(!is.na(sex)) |>
count(species, island, sex) |>
mutate(group = paste(species, "on", island),
side = ifelse(sex == "female", -n, n))
p <- ggplot(sexes, aes(x = side, y = group, fill = sex)) +
geom_col(width = 0.7) +
geom_vline(xintercept = 0, colour = "#535353", linewidth = 0.4) +
annotate("text", x = c(-30, 30), y = 5.6, label = c("Females", "Males"),
colour = c("#9b2367", "#2e7891"), size = 3.2) +
scale_fill_manual(values = c(female = "#9b2367", male = "#2e7891")) +
scale_x_continuous(labels = \(x) lex_number(abs(x)), limits = c(-65, 65)) +
scale_y_discrete(limits = rev, expand = expansion(add = c(0.6, 1))) +
labs(title = "Every group has nearly as many females as males",
subtitle = "333 penguins of known sex, Palmer Archipelago",
x = "Penguins", y = NULL,
caption = "Data: palmerpenguins (Horst, Hill & Gorman 2020)") +
theme_lex_viz(grid = "x", arrows = "") +
theme(legend.position = "none")Sources (16)
32 occurrences in the corpus
Show the 16 sources
- Atlas of knowledge: anyone can map
- Better data visualizations: a guide for scholars, researchers, and wonks
- Building Science Graphics: An Illustrated Guide to Communicating Science through Diagra...
- Data visualisation: a handbook for data driven design
- Design for information: an introduction to the histories, theories, and best practices ...
- Effective data visualization: the right chart for the right data
- Financial Times Visual Vocabulary
- Information graphics
- Information Graphics: A Comprehensive Illustrated Reference
- Making and Breaking the Grid, Third Edition
- Seeing with fresh eyes: meaning, space, data, truth
- The art of insight: how great visualization designers think
- The elements of typographic style
- The infographic history of the world
- The Oxford Handbook of Empirical Aesthetics
- Visual explanations: images and quantities, evidence and narrative
Cite this entry
Stable addresshttps://dataviz.adrientaudiere.com/en-only/term/spine-chart.html
ReferenceTaudière Adrien. 2026. spine chart. In Visualization Vocabulary, version 1.0.0. IdEst. https://dataviz.adrientaudiere.com/en-only/term/spine-chart.html
BibTeX
@incollection{taudiere2026-spine-chart,
  author    = {Taudière, Adrien},
  title     = {spine chart},
  booktitle = {Visualization Vocabulary},
  year      = {2026},
  version   = {1.0.0},
  publisher = {IdEst},
  url       = {https://dataviz.adrientaudiere.com/en-only/term/spine-chart.html},
  note      = {CC0 1.0}
}Page created on 2026-10-13. Text last changed on 2026-11-10. Images last changed on 2026-11-02. Numbers computed on 2026-10-22.