
 chart
spine chart
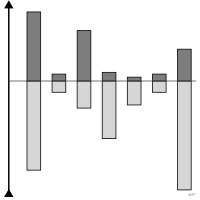
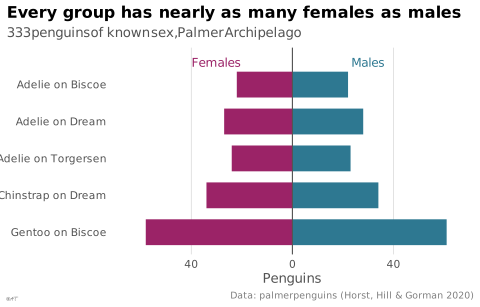
also: spineSingle value split into two opposed components either side of an axis.
graphique en épine
aussi : spineValeur unique scindée en deux composantes opposées de part et d'autre d'un axe.
Cas particulier du diagramme en barres divergentes. Le Visual Vocabulary français garde le terme anglais, faute d'équivalent établi.
Classification
- chart
- bars › diverging bars
- deviation; Financial Times Visual Vocabulary
- the name evokes: nature
Channels
 position on common scale; secondary: total on each side of the axis
 length; main: share of each component
 spatial region; main: component, on each side of the axis
 color hue; secondary: component
Attestation
- French term: Common usage, not attested by a source
- English definition: Financial Times Visual Vocabulary
Scientific literature
OpenAlex: 3 papers since 2026, 33% in the last five years; mostly in Medicine, Mathematics
R code of the ggplot2 example
library(ggplot2)
library(dplyr)
library(palmerpenguins)
## Each group split on either side of the spine: females left, males right.
sexes <- penguins |>
filter(!is.na(sex)) |>
count(species, island, sex) |>
mutate(group = paste(species, "on", island),
side = ifelse(sex == "female", -n, n))
p <- ggplot(sexes, aes(x = side, y = group, fill = sex)) +
geom_col(width = 0.7) +
geom_vline(xintercept = 0, colour = "#535353", linewidth = 0.4) +
annotate("text", x = c(-30, 30), y = 5.6, label = c("Females", "Males"),
colour = c("#9b2367", "#2e7891"), size = 3.2) +
scale_fill_manual(values = c(female = "#9b2367", male = "#2e7891")) +
scale_x_continuous(labels = \(x) lex_number(abs(x)), limits = c(-65, 65)) +
scale_y_discrete(limits = rev, expand = expansion(add = c(0.6, 1))) +
labs(title = "Every group has nearly as many females as males",
subtitle = "333 penguins of known sex, Palmer Archipelago",
x = "Penguins", y = NULL,
caption = "Data: palmerpenguins (Horst, Hill & Gorman 2020)") +
theme_lex_viz(grid = "x", arrows = "") +
theme(legend.position = "none")Sources (16)
32 occurrences in the corpus
Show the 16 sources
- Atlas of knowledge: anyone can map
- Better data visualizations: a guide for scholars, researchers, and wonks
- Building Science Graphics: An Illustrated Guide to Communicating Science through Diagra...
- Data visualisation: a handbook for data driven design
- Design for information: an introduction to the histories, theories, and best practices ...
- Effective data visualization: the right chart for the right data
- Financial Times Visual Vocabulary
- Information graphics
- Information Graphics: A Comprehensive Illustrated Reference
- Making and Breaking the Grid, Third Edition
- Seeing with fresh eyes: meaning, space, data, truth
- The art of insight: how great visualization designers think
- The elements of typographic style
- The infographic history of the world
- The Oxford Handbook of Empirical Aesthetics
- Visual explanations: images and quantities, evidence and narrative
Cite this entry
Stable addresshttps://dataviz.adrientaudiere.com/en/term/spine-chart.html
ReferenceTaudière Adrien. 2026. spine chart. In Visualization Vocabulary, version 1.0.0. IdEst. https://dataviz.adrientaudiere.com/en/term/spine-chart.html
BibTeX
@incollection{taudiere2026-spine-chart,
  author    = {Taudière, Adrien},
  title     = {spine chart},
  booktitle = {Visualization Vocabulary},
  year      = {2026},
  version   = {1.0.0},
  publisher = {IdEst},
  url       = {https://dataviz.adrientaudiere.com/en/term/spine-chart.html},
  note      = {CC0 1.0}
}Page created on 2026-10-13. Text last changed on 2026-11-10. Images last changed on 2026-11-02. Numbers computed on 2026-10-22.