
 graphique
 en épine
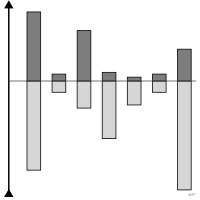
aussi : spineValeur unique scindée en deux composantes opposées de part et d'autre d'un axe.
spine chart
also: spineSingle value split into two opposed components either side of an axis.
Cas particulier du diagramme en barres divergentes. Le Visual Vocabulary français garde le terme anglais, faute d'équivalent établi.
Classification
- graphique
- barres › barres divergentes
- écart; Visual Vocabulary du Financial Times
- le nom évoque : nature
Canaux
 position sur une échelle commune; secondaire : total de chaque côté de l'axe
 longueur; principal : part de chaque composante
 région de l'espace; principal : composante, par côté de l'axe
 teinte; secondaire : composante
Attestation
- terme français : Usage courant, non attesté par une source
- définition anglaise : Visual Vocabulary du Financial Times
Littérature scientifique
OpenAlex : 3 articles depuis 2026, dont 33 % ces cinq dernières années; surtout en Medicine, Mathematics
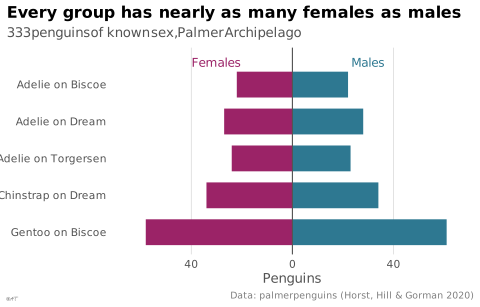
Code R de l'exemple ggplot2
library(ggplot2)
library(dplyr)
library(palmerpenguins)
## Each group split on either side of the spine: females left, males right.
sexes <- penguins |>
filter(!is.na(sex)) |>
count(species, island, sex) |>
mutate(group = paste(species, "on", island),
side = ifelse(sex == "female", -n, n))
p <- ggplot(sexes, aes(x = side, y = group, fill = sex)) +
geom_col(width = 0.7) +
geom_vline(xintercept = 0, colour = "#535353", linewidth = 0.4) +
annotate("text", x = c(-30, 30), y = 5.6, label = c("Females", "Males"),
colour = c("#9b2367", "#2e7891"), size = 3.2) +
scale_fill_manual(values = c(female = "#9b2367", male = "#2e7891")) +
scale_x_continuous(labels = \(x) lex_number(abs(x)), limits = c(-65, 65)) +
scale_y_discrete(limits = rev, expand = expansion(add = c(0.6, 1))) +
labs(title = "Every group has nearly as many females as males",
subtitle = "333 penguins of known sex, Palmer Archipelago",
x = "Penguins", y = NULL,
caption = "Data: palmerpenguins (Horst, Hill & Gorman 2020)") +
theme_lex_viz(grid = "x", arrows = "") +
theme(legend.position = "none")Sources (16)
32 occurrences dans le corpus
Afficher les 16 sources
- Atlas of knowledge: anyone can map
- Better data visualizations: a guide for scholars, researchers, and wonks
- Building Science Graphics: An Illustrated Guide to Communicating Science through Diagra...
- Data visualisation: a handbook for data driven design
- Design for information: an introduction to the histories, theories, and best practices ...
- Effective data visualization: the right chart for the right data
- Information graphics
- Information Graphics: A Comprehensive Illustrated Reference
- Making and Breaking the Grid, Third Edition
- Seeing with fresh eyes: meaning, space, data, truth
- The art of insight: how great visualization designers think
- The elements of typographic style
- The infographic history of the world
- The Oxford Handbook of Empirical Aesthetics
- Visual explanations: images and quantities, evidence and narrative
- Visual Vocabulary du Financial Times
Citer cette fiche
Adresse stablehttps://dataviz.adrientaudiere.com/terme/spine-chart.html
RéférenceTaudière Adrien. 2026. graphique en épine. Dans Visualization Vocabulary, version 1.0.0. IdEst. https://dataviz.adrientaudiere.com/terme/spine-chart.html
BibTeX
@incollection{taudiere2026-spine-chart,
  author    = {Taudière, Adrien},
  title     = {graphique en épine},
  booktitle = {Visualization Vocabulary},
  year      = {2026},
  version   = {1.0.0},
  publisher = {IdEst},
  url       = {https://dataviz.adrientaudiere.com/terme/spine-chart.html},
  note      = {CC0 1.0}
}Fiche créée le 13/10/2026. Texte modifié le 10/11/2026. Images modifiées le 02/11/2026. Chiffres calculés le 22/10/2026.