
 chart
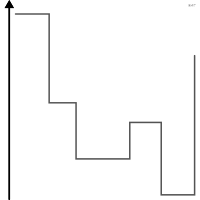
step chart
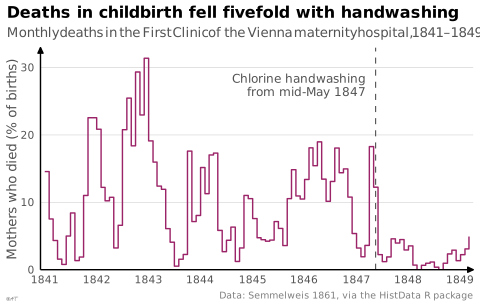
Line with plateaus marking discrete changes.
Classification
- chart
- lines and areas › lines
- change over time
- the name evokes: building
Channels
 position on common scale; main: value (steps)
Variants
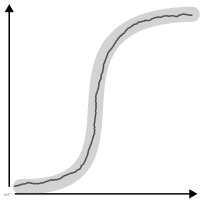 empirical cumulative distribution functionspecial case
Scientific literature
OpenAlex: 47 papers since 1993, 28% in the last five years; mostly in Medicine, Computer Science, Social Sciences
R packages
- R
ggplot2::geom_step(); GitHub 7 025 stars; last commit 2026-10; paper (33 455 citations)
R code of the ggplot2 example
library(ggplot2)
library(dplyr)
library(HistData)
## December 1841 is missing: its step is left out.
mortality <- Handwashing.monthly |>
filter(!is.na(deaths)) |>
mutate(rate = 100 * deaths / births)
p <- ggplot(mortality, aes(x = date, y = rate)) +
geom_step(linewidth = 0.5, colour = "#9b2367") +
geom_vline(xintercept = as.Date("1847-05-15"), colour = "#535353", linewidth = 0.4, linetype = "dashed") +
annotate("text", x = as.Date("1847-03-01"), y = 29, label = "Chlorine handwashing\nfrom mid-May 1847",
hjust = 1, vjust = 1, size = 3.2, colour = "#535353", lineheight = 0.9) +
scale_x_date(date_breaks = "1 year", date_labels = "%Y", expand = expansion(mult = 0.01)) +
scale_y_continuous(labels = lex_number, limits = c(0, NA), expand = expansion(mult = c(0, 0.05))) +
labs(title = "Deaths in childbirth fell fivefold with handwashing",
subtitle = "Monthly deaths in the First Clinic of the Vienna maternity hospital, 1841–1849",
x = NULL, y = "Mothers who died (% of births)",
caption = "Data: Semmelweis 1861, via the HistData R package") +
theme_lex_viz(grid = "y")Sources (6)
21 occurrences in the corpus; indexed by 1 book
Cite this entry
Stable addresshttps://dataviz.adrientaudiere.com/en-only/term/step-chart.html
ReferenceTaudière Adrien. 2026. step chart. In Visualization Vocabulary, version 1.0.0. IdEst. https://dataviz.adrientaudiere.com/en-only/term/step-chart.html
BibTeX
@incollection{taudiere2026-step-chart,
  author    = {Taudière, Adrien},
  title     = {step chart},
  booktitle = {Visualization Vocabulary},
  year      = {2026},
  version   = {1.0.0},
  publisher = {IdEst},
  url       = {https://dataviz.adrientaudiere.com/en-only/term/step-chart.html},
  note      = {CC0 1.0}
}Page created on 2026-10-13. Text last changed on 2026-10-22. Images last changed on 2026-11-02. Numbers computed on 2026-10-22.