
 graphique
 en escalier
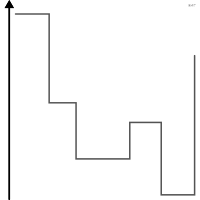
Courbe à paliers marquant des changements discrets.
step chart
Line with plateaus marking discrete changes.
Classification
- graphique
- courbes et aires › courbes
- évolution dans le temps
- le nom évoque : construction
Canaux
 position sur une échelle commune; principal : valeur (paliers)
Variantes
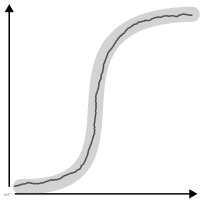 fonction de répartition empiriquecas particulier
Attestation
- terme français : Usage courant, non attesté par une source
Littérature scientifique
OpenAlex : 47 articles depuis 1993, dont 28 % ces cinq dernières années; surtout en Medicine, Computer Science, Social Sciences
Paquets R
- R
ggplot2::geom_step(); GitHub 7 025 étoiles; dernier commit 2026-10; article (33 455 citations)
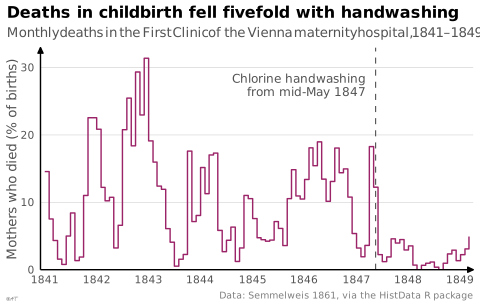
Code R de l'exemple ggplot2
library(ggplot2)
library(dplyr)
library(HistData)
## December 1841 is missing: its step is left out.
mortality <- Handwashing.monthly |>
filter(!is.na(deaths)) |>
mutate(rate = 100 * deaths / births)
p <- ggplot(mortality, aes(x = date, y = rate)) +
geom_step(linewidth = 0.5, colour = "#9b2367") +
geom_vline(xintercept = as.Date("1847-05-15"), colour = "#535353", linewidth = 0.4, linetype = "dashed") +
annotate("text", x = as.Date("1847-03-01"), y = 29, label = "Chlorine handwashing\nfrom mid-May 1847",
hjust = 1, vjust = 1, size = 3.2, colour = "#535353", lineheight = 0.9) +
scale_x_date(date_breaks = "1 year", date_labels = "%Y", expand = expansion(mult = 0.01)) +
scale_y_continuous(labels = lex_number, limits = c(0, NA), expand = expansion(mult = c(0, 0.05))) +
labs(title = "Deaths in childbirth fell fivefold with handwashing",
subtitle = "Monthly deaths in the First Clinic of the Vienna maternity hospital, 1841–1849",
x = NULL, y = "Mothers who died (% of births)",
caption = "Data: Semmelweis 1861, via the HistData R package") +
theme_lex_viz(grid = "y")Sources (6)
21 occurrences dans le corpus; indexé par 1 ouvrage
Citer cette fiche
Adresse stablehttps://dataviz.adrientaudiere.com/terme/step-chart.html
RéférenceTaudière Adrien. 2026. graphique en escalier. Dans Visualization Vocabulary, version 1.0.0. IdEst. https://dataviz.adrientaudiere.com/terme/step-chart.html
BibTeX
@incollection{taudiere2026-step-chart,
  author    = {Taudière, Adrien},
  title     = {graphique en escalier},
  booktitle = {Visualization Vocabulary},
  year      = {2026},
  version   = {1.0.0},
  publisher = {IdEst},
  url       = {https://dataviz.adrientaudiere.com/terme/step-chart.html},
  note      = {CC0 1.0}
}Fiche créée le 13/10/2026. Texte modifié le 22/10/2026. Images modifiées le 02/11/2026. Chiffres calculés le 22/10/2026.