
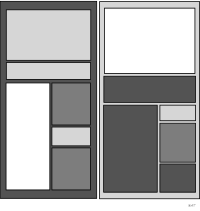


 chart
treemap
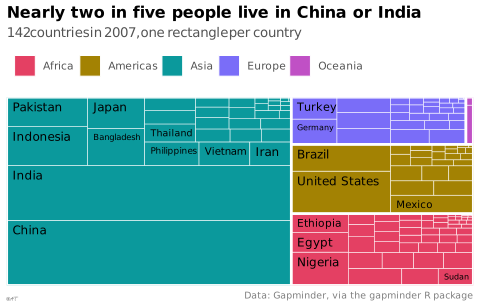
Hierarchy tiled with nested rectangles sized by value.
Classification
- chart
- sectors, tilings and units › tilings
- part-to-whole; Financial Times Visual Vocabulary
- the name evokes: nature
Channels
 area; main: value (Munzner: area marks and nesting); Munzner 2014
 spatial region; main: hierarchy (nesting); Munzner 2014
 color hue; secondary: category; Munzner 2014
Variants
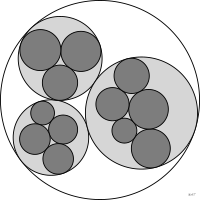 circle packingcircles
Attestation
- English definition: Data Visualisation Guide, data.europa.eu
Scientific literature
OpenAlex: 1 857 papers since 1992, 32% in the last five years; mostly in Computer Science, Social Sciences, Agricultural and Biological Sciences; Wikidata
Seminal references
- first known use (1874) Walker (1874). Statistical Atlas of the United States, Based on the Results of the Ninth Census; Ciuccarelli 2026
- formalization (1991) Johnson & Shneiderman (1991). Tree-maps: a space-filling approach to the visualization of hierarchical information structures. Proceedings Visualization '91 (637 citations)
- diffusion (1992) Shneiderman (1992). Tree visualization with tree-maps. ACM Transactions on Graphics (1 338 citations); Friendly & Denis 2001
R packages
- R
treemapify::geom_treemap(); GitHub 223 stars; last commit 2026-07
R code of the ggplot2 example
library(ggplot2)
library(treemapify)
library(dplyr)
library(gapminder)
population <- gapminder |>
filter(year == 2007)
p <- ggplot(population, aes(area = pop, fill = continent, subgroup = continent, label = country)) +
geom_treemap(colour = "white", size = 0.5) +
geom_treemap_subgroup_border(colour = "white", size = 2.5) +
geom_treemap_text(family = "Quicksand", colour = "black", place = "topleft",
padding.x = grid::unit(1.5, "mm"), padding.y = grid::unit(1.5, "mm"),
size = 9, min.size = 6) +
scale_fill_manual(values = continent_colors) +
labs(title = "Nearly two in five people live in China or India",
subtitle = "142 countries in 2007, one rectangle per country",
fill = NULL,
caption = "Data: Gapminder, via the gapminder R package") +
theme_lex_viz(grid = "", arrows = "")Sources (47)
460 occurrences in the corpus; indexed by 18 books
Show the 47 sources
- app.flourish.studio
- Atlas of knowledge: anyone can map
- Better data visualizations: a guide for scholars, researchers, and wonks
- Bremer & Barone, Chart, CRC Press, 2025
- Data fluency: empowering your organization with effective data communication
- Data points: visualization that means something
- Data Visualisation Guide, data.europa.eu
- Data visualisation: a handbook for data driven design
- Data visualization handbook
- Data visualization: a practical introduction
- Data Viz Project
- Data-driven storytelling
- data-to-viz.com
- datavizproject.com
- datawrapper.de↗
- Design for information: an introduction to the histories, theories, and best practices ...
- Effective data storytelling: how to drive change with data, narrative, and visuals
- Effective data visualization: the right chart for the right data
- Elavsky, Chartability: POUR-CAF accessibility heuristics
- Exploratory Data Analysis: Descriptive Analysis, Visualization, and Dashboard Design (w...
- Focus+context display and navigation techniques for enhancing radial, space-filling hie...
- From data to viz
- Fundamentals of computer graphics
- Handling and mapping geographic information
- How charts lie: getting smarter about visual information
- Information theory tools for visualization
- Interactive data visualization: foundations, techniques, and applications
- Milestones in the history of thematic cartography, statistical graphics, and data visua...
- More Practical Charts
- Practical charts: the essential guide to creating clear, compelling charts for reports ...
- Progressive Data Analysis: Roadmap and Research Agenda
- python-graph-gallery.com
- The big book of dashboards: visualizing your data using real-world business scenarios
- The book of circles: visualizing spheres of knowledge
- The book of trees: visualizing branches of knowledge
- The eyes have it: A task by data type taxonomy for information visualizations
- The grammar of graphics
- Thematic Cartography and Geovisualization
- Visualization Analysis and Design
- Visualization of Time-Oriented Data
- Visualize This
- Visualizing with text
- Wickham, Navarro & Pedersen, ggplot2: Elegant Graphics for Data Analysis, 3rd ed. online↗
- Wikipedia — Data and information visualization
- Wikipedia in English↗
- Wilke, Fundamentals of Data Visualization, O'Reilly, 2019
- xeno.graphics↗
Cite this entry
Stable addresshttps://dataviz.adrientaudiere.com/en-only/term/treemap.html
ReferenceTaudière Adrien. 2026. treemap. In Visualization Vocabulary, version 1.0.0. IdEst. https://dataviz.adrientaudiere.com/en-only/term/treemap.html
BibTeX
@incollection{taudiere2026-treemap,
  author    = {Taudière, Adrien},
  title     = {treemap},
  booktitle = {Visualization Vocabulary},
  year      = {2026},
  version   = {1.0.0},
  publisher = {IdEst},
  url       = {https://dataviz.adrientaudiere.com/en-only/term/treemap.html},
  note      = {CC0 1.0}
}Page created on 2026-10-13. Text last changed on 2026-11-12. Images last changed on 2026-11-02. Numbers computed on 2026-10-22.