
 chart
confection
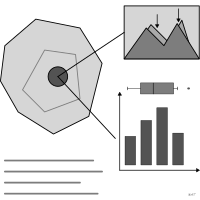
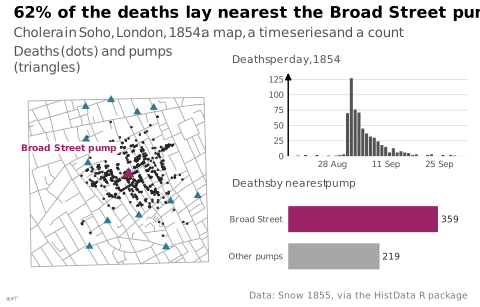
Assembly of visual events drawn from various sources and juxtaposed to carry an argument.
confection
Assemblage d'images d'origines diverses juxtaposées pour porter un argument.
Terme de Tufte, sans équivalent français établi. Ni carte ni graphique conventionnel : ce que le collage est à l'art, la confection l'est au design d'information.
Classification
- chart
- non-chart figures
Attestation
- French term: Common usage, not attested by a source
- English definition: Tufte, Visual Explanations, 1997
Seminal references
- naming (1997) Tufte (1997). Visual Explanations: Images and Quantities, Evidence and Narrative. Graphics Press; Visual explanations: images and quantities
R code of the ggplot2 example
library(ggplot2)
library(dplyr)
library(HistData)
library(patchwork)
## Three pieces of different kinds, set side by side for one argument about
## the 1854 cholera outbreak in Soho: a map, a time series, a count.
nearest <- apply(Snow.deaths[, c("x", "y")], 1, function(d) {
Snow.pumps$label[which.min((Snow.pumps$x - d[1])^2 + (Snow.pumps$y - d[2])^2)]
})
by_pump <- tibble(pump = ifelse(nearest == "Broad St", "Broad Street", "Other pumps")) |>
count(pump) |>
mutate(pump = factor(pump, levels = c("Other pumps", "Broad Street")))
broad <- filter(Snow.pumps, label == "Broad St")
no_bg <- theme(plot.background = element_rect(fill = NA, colour = NA))
map <- ggplot() +
geom_path(data = Snow.streets, aes(x = x, y = y, group = street), colour = "#a6a6a6", linewidth = 0.3) +
geom_point(data = Snow.deaths, aes(x = x, y = y), colour = "#262626", size = 0.3) +
geom_point(data = Snow.pumps, aes(x = x, y = y), shape = 17, colour = "#2e7891", size = 1.8) +
geom_point(data = broad, aes(x = x, y = y), shape = 17, colour = "#9b2367", size = 2.8) +
annotate("label", x = broad$x - 0.8, y = broad$y + 2.4, label = "Broad Street pump",
colour = "#9b2367", fill = "white", linewidth = 0, size = 2.4, hjust = 1, fontface = "bold") +
coord_equal(xlim = c(3, 20), ylim = c(3, 20)) +
labs(subtitle = "Deaths (dots) and pumps (triangles)") +
theme_lex_viz(grid = "", arrows = "") +
theme(axis.text = element_blank(), axis.title = element_blank()) + no_bg
curve <- ggplot(filter(Snow.dates, !is.na(date)), aes(x = date, y = deaths)) +
geom_col(fill = "#535353", width = 0.8) +
scale_x_date(labels = scales::label_date("%d %b", locale = "en"), date_breaks = "2 weeks") +
scale_y_continuous(expand = expansion(mult = c(0, 0.05))) +
labs(subtitle = "Deaths per day, 1854", x = NULL, y = NULL) +
theme_lex_viz(base_size = 8, grid = "y", arrows = "y") + no_bg
pumps <- ggplot(by_pump, aes(x = n, y = pump, fill = pump)) +
geom_col(width = 0.7) +
geom_text(aes(label = n), hjust = -0.2, size = 2.4, colour = "#262626") +
scale_fill_manual(values = c(`Broad Street` = "#9b2367", `Other pumps` = "#a6a6a6"), guide = "none") +
scale_x_continuous(expand = expansion(mult = c(0, 0.2))) +
labs(subtitle = "Deaths by nearest pump", x = NULL, y = NULL) +
theme_lex_viz(base_size = 8, grid = "", arrows = "") +
theme(axis.text.x = element_blank()) + no_bg
p <- map + (curve / pumps) +
plot_layout(widths = c(1.15, 1)) +
plot_annotation(
title = "62% of the deaths lay nearest the Broad Street pump",
subtitle = "Cholera in Soho, London, 1854: a map, a time series and a count",
caption = "Data: Snow 1855, via the HistData R package",
theme = theme_lex_viz() + no_bg
) &
no_bgSources (7)
25 occurrences in the corpus; indexed by 1 book
- Beautiful evidence
- Data visualization handbook
- Rakotomalala, statistics course notes (Université Lyon 2)
- Seeing with fresh eyes: meaning, space, data, truth
- Semiologie graphique: les diagrammes, les réseaux, les cartes.
- Tufte, Visual Explanations, 1997
- Visual explanations: images and quantities, evidence and narrative
Cite this entry
Stable addresshttps://dataviz.adrientaudiere.com/en/term/confection.html
ReferenceTaudière Adrien. 2026. confection. In Visualization Vocabulary, version 1.0.0. IdEst. https://dataviz.adrientaudiere.com/en/term/confection.html
BibTeX
@incollection{taudiere2026-confection,
  author    = {Taudière, Adrien},
  title     = {confection},
  booktitle = {Visualization Vocabulary},
  year      = {2026},
  version   = {1.0.0},
  publisher = {IdEst},
  url       = {https://dataviz.adrientaudiere.com/en/term/confection.html},
  note      = {CC0 1.0}
}Page created on 2026-10-13. Text last changed on 2026-11-02. Images last changed on 2026-11-12. Numbers computed on 2026-10-22.