
 chart
heatmap
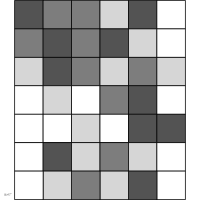
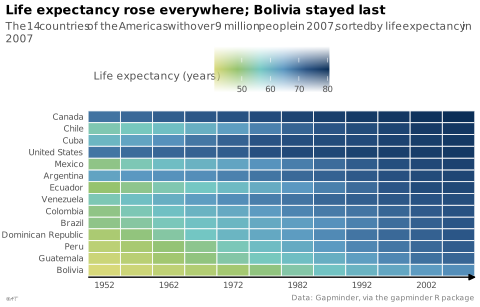
also: heat map, XY heatmapMatrix whose cells are colored by value.
carte de chaleur
aussi : matrice de chaleur, carte thermiqueMatrice dont chaque cellule est colorée selon une valeur.
Classification
- chart
- matrices and tables › heat matrices
- correlation; Financial Times Visual Vocabulary
- the name evokes: nature
Channels
 color luminance; main: value; Munzner 2014
 color saturation; main: value (instead of luminance)
 spatial region; main: row and column (matrix alignment); Munzner 2014
 color hue; secondary: sign or category (diverging palette / qualitative palette); Munzner 2014
Variants
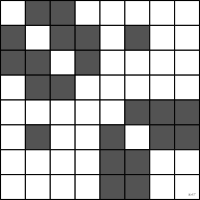 adjacency matrixnodes in rows and columns
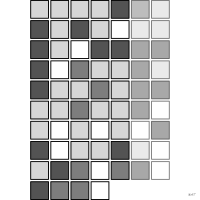 calendar heatmapcalendar
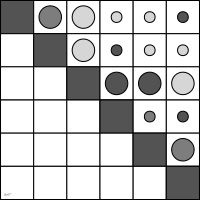 corrgramcorrelations
Attestation
- French term: Lagnel, Manuel de datavisualisation, Dunod, 2021
- English definition: ggplot2 reference
Scientific literature
OpenAlex: 39 141 papers since 1948, 71% in the last five years; mostly in Computer Science, Medicine, Biochemistry, Genetics and Molecular Biology; Wikidata
Seminal references
- first known use (1873) Loua (1873). Atlas statistique de la population de Paris; Friendly & Denis 2001, Andrews 2017, Wikipedia in English
- diffusion (1998) Eisen et al. (1998). Cluster analysis and display of genome-wide expression patterns. Proceedings of the National Academy of Sciences (16 185 citations); Wikipedia in English
R packages
- R
ggplot2::geom_tile(); GitHub 7 025 stars; last commit 2026-10; paper (33 455 citations) - R
ComplexHeatmap::Heatmap(); GitHub 1 561 stars; last commit 2026-04; paper (10 117 citations) Bioconductor. - R
pheatmap::pheatmap(); paper (1 187 citations)
R code of the ggplot2 example
library(ggplot2)
library(dplyr)
library(gapminder)
americas <- gapminder |>
filter(continent == "Americas") |>
group_by(country) |>
filter(pop[year == max(year)] >= 9e6) |>
mutate(last = lifeExp[year == max(year)]) |>
ungroup() |>
mutate(country = reorder(country, last))
p <- ggplot(americas, aes(x = year, y = country, fill = lifeExp)) +
geom_tile(colour = "white", linewidth = 0.3) +
scale_x_continuous(breaks = seq(1952, 2007, 10), expand = c(0, 0)) +
scale_fill_continuous(labels = lex_number) +
labs(title = "Life expectancy rose everywhere; Bolivia stayed last",
subtitle = "The 14 countries of the Americas with over 9 million people in 2007, sorted by life expectancy in 2007",
x = NULL, y = NULL, fill = "Life expectancy (years)",
caption = "Data: Gapminder, via the gapminder R package") +
theme_lex_viz(base_size = 8, grid = "", arrows = "x")Sources (54)
384 occurrences in the corpus; indexed by 17 books
Show the 54 sources
- app.flourish.studio
- Applied Multivariate Statistics in R
- Atlas of knowledge: anyone can map
- Ault, Nam Liao & Musolino, Principles of Data Science, OpenStax, 2025
- Better data visualizations: a guide for scholars, researchers, and wonks
- Bremer & Barone, Chart, CRC Press, 2025
- Computational statistics in data science
- Data points: visualization that means something
- Data sketches
- Data Visualisation Guide, data.europa.eu
- Data visualisation: a handbook for data driven design
- Data visualization handbook
- Data visualization: a practical introduction
- Data-driven storytelling
- data-to-viz.com
- dataphys.org
- datawrapper.de↗
- Design for information: an introduction to the histories, theories, and best practices ...
- Effective data storytelling: how to drive change with data, narrative, and visuals
- Effective data visualization: the right chart for the right data
- Exploratory Data Analysis: Descriptive Analysis, Visualization, and Dashboard Design (w...
- French Wikipedia↗
- French Wikipedia — Visualisation de données
- From data to viz
- ggplot2 reference
- How charts lie: getting smarter about visual information
- Info we trust: how to inspire the world with data
- Interactive data visualization: foundations, techniques, and applications
- Lagnel, Manuel de datavisualisation, Dunod, 2021
- Les fondamentaux de la visualisation de données
- LibreTexts Statistics, textbook chapters on charts
- Manuel de datavisualisation - 2e éd, vol. 2
- More Practical Charts
- Open Visualization Academy, courses and newsletter (Cairo et al.)
- Practical charts: the essential guide to creating clear, compelling charts for reports ...
- python-graph-gallery.com
- Storytelling with data: let's practice!
- The art of insight: how great visualization designers think
- The big book of dashboards: visualizing your data using real-world business scenarios
- The functional art: an introduction to information graphics and visualization
- The golden age of data visualization: how did we get here?
- The grammar of graphics
- The Oxford Handbook of Empirical Aesthetics
- The Truthful Art: Data, Charts, and Maps for Communication
- The Wall Street journal guide to information graphics: the dos and don'ts of presenting...
- Thematic Cartography and Geovisualization
- UMATO: Bridging Local and Global Structures for Reliable Visual Analytics With Dimensio...
- Visual strategies for biological data
- Visualization Analysis and Design
- Visualization of Time-Oriented Data
- Visualize This
- Visualizing with text
- Wikipedia in English↗
- Wilke, Fundamentals of Data Visualization, O'Reilly, 2019
Cite this entry
Stable addresshttps://dataviz.adrientaudiere.com/en/term/heatmap.html
ReferenceTaudière Adrien. 2026. heatmap. In Visualization Vocabulary, version 1.0.0. IdEst. https://dataviz.adrientaudiere.com/en/term/heatmap.html
BibTeX
@incollection{taudiere2026-heatmap,
  author    = {Taudière, Adrien},
  title     = {heatmap},
  booktitle = {Visualization Vocabulary},
  year      = {2026},
  version   = {1.0.0},
  publisher = {IdEst},
  url       = {https://dataviz.adrientaudiere.com/en/term/heatmap.html},
  note      = {CC0 1.0}
}Page created on 2026-10-13. Text last changed on 2026-11-12. Images last changed on 2026-11-12. Numbers computed on 2026-10-22.