
 chart
Ishikawa diagram
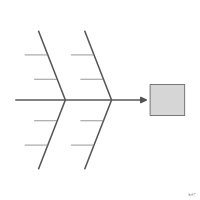
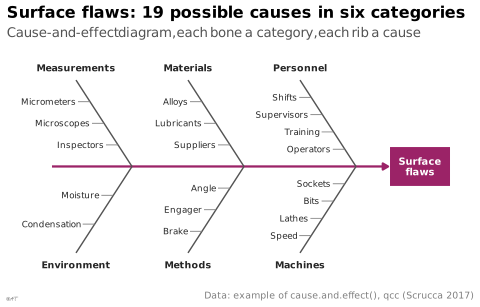
Fish-skeleton diagram that sorts the possible causes of an effect into categories, drawn as slanted bones along a central spine leading to the effect.
diagramme d'Ishikawa
Schéma en forme de squelette de poisson qui range les causes possibles d'un effet en catégories, disposées en arêtes obliques le long d'une arête centrale menant à l'effet.
Outil de gestion de la qualité popularisé par Kaoru Ishikawa dans les années 1960, dont les catégories suivent souvent les 5M. Il ne code aucune quantité : la hiérarchie des causes est qualitative.
Classification
- chart
- networks and trees › hierarchical trees
- the name evokes: eponym
Channels
 tilt/angle; secondary: cause level (slanted bone for the category, horizontal for the cause)
 spatial region; main: cause category
Attestation and synonyms
- French term: French Wikipedia↗
- English definition: Information Graphics: A Comprehensive Illustrated Reference
- fishbone diagram; Information Graphics: A Comprehensive Illustrated Reference
- cause-and-effect diagram; Information Graphics: A Comprehensive Illustrated Reference
- diagramme de causes et effets; French Wikipedia↗
- diagramme en arêtes de poisson; French Wikipedia↗
Scientific literature
OpenAlex: 9 441 papers since 1978, 51% in the last five years; mostly in Business, Management and Accounting, Engineering, Medicine; Wikidata
Seminal references
R packages
- R
SixSigma::ss.ceDiag(); GitHub; paper - R
qcc::cause.and.effect(); GitHub; paper CRAN 2.7 (2017) ; la 3.0 de GitHub ajoute causeEffectDiagram.
R code of the ggplot2 example
library(ggplot2)
library(dplyr)
## The example of qcc::cause.and.effect() (Scrucca 2017, GPL >= 2), copied
## here so that the script does not need qcc: the possible causes of surface
## flaws on machined parts, grouped by category. Categories above the spine,
## then below it, in the order of the help page.
causes <- list(
Measurements = c("Micrometers", "Microscopes", "Inspectors"),
Materials = c("Alloys", "Lubricants", "Suppliers"),
Personnel = c("Shifts", "Supervisors", "Training", "Operators"),
Environment = c("Condensation", "Moisture"),
Methods = c("Brake", "Engager", "Angle"),
Machines = c("Speed", "Lathes", "Bits", "Sockets")
)
dx <- 14 # horizontal run of a bone, from its outer end to the spine
bones <- tibble(category = names(causes), x = rep(c(6, 34, 62), 2),
y = rep(c(10, -10), each = 3)) |>
mutate(xend = x + dx, yend = 0)
## Each cause is a short horizontal rib on its bone, evenly spaced along it.
ribs <- bones |>
rowwise() |>
reframe(category = category, cause = causes[[category]],
t = seq_along(cause) / (length(cause) + 1),
xend = x + t * dx, y = y * (1 - t)) |>
mutate(x = xend - 3)
stopifnot(nrow(ribs) == 19, nrow(bones) == 6)
p <- ggplot() +
annotate("segment", x = 0, xend = 84, y = 0, yend = 0, colour = "#9b2367", linewidth = 0.8,
arrow = grid::arrow(length = unit(1.6, "mm"), type = "closed")) +
geom_segment(data = bones, aes(x = x, y = y, xend = xend, yend = yend), colour = "#535353", linewidth = 0.5) +
geom_segment(data = ribs, aes(x = x, y = y, xend = xend, yend = y), colour = "#7d7d7d", linewidth = 0.3) +
geom_text(data = ribs, aes(x = x - 0.5, y = y, label = cause), hjust = 1, size = 2.3, colour = "#262626") +
geom_text(data = bones, aes(x = x, y = y + 1.4 * sign(y), label = category),
fontface = "bold", size = 2.5, colour = "#262626") +
annotate("tile", x = 92, y = 0, width = 15, height = 4.5, fill = "#9b2367") +
annotate("text", x = 92, y = 0, label = "Surface\nflaws", colour = "white", fontface = "bold",
size = 2.6, lineheight = 0.9) +
scale_x_continuous(limits = c(-6, 100)) +
scale_y_continuous(limits = c(-12.5, 12.5)) +
labs(title = "Surface flaws: 19 possible causes in six categories",
subtitle = "Cause-and-effect diagram, each bone a category, each rib a cause",
x = NULL, y = NULL,
caption = "Data: example of cause.and.effect(), qcc (Scrucca 2017)") +
theme_lex_viz(grid = "", arrows = "") +
theme(axis.text = element_blank())Sources (3)
5 occurrences in the corpus
Cite this entry
Stable addresshttps://dataviz.adrientaudiere.com/en/term/ishikawa-diagram.html
ReferenceTaudière Adrien. 2026. Ishikawa diagram. In Visualization Vocabulary, version 1.0.0. IdEst. https://dataviz.adrientaudiere.com/en/term/ishikawa-diagram.html
BibTeX
@incollection{taudiere2026-ishikawa-diagram,
  author    = {Taudière, Adrien},
  title     = {Ishikawa diagram},
  booktitle = {Visualization Vocabulary},
  year      = {2026},
  version   = {1.0.0},
  publisher = {IdEst},
  url       = {https://dataviz.adrientaudiere.com/en/term/ishikawa-diagram.html},
  note      = {CC0 1.0}
}Page created on 2026-11-09. Text last changed on 2026-11-10. Images last changed on 2026-11-10. Numbers computed on 2026-10-22.