
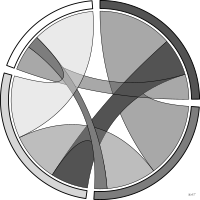
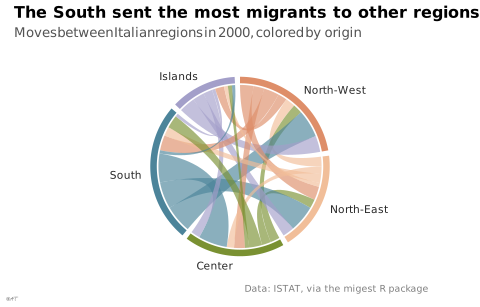

 graphique
diagramme en accords
aussi : cordeRelations entre entités disposées sur un cercle.
chord diagram
also: circular chartRelationships between entities placed around a circle.
Lagnel emploie « diagramme circulaire » pour cette forme, mais l'usage général et le Visual Vocabulary réservent ce terme au camembert. Préférer « diagramme en accords » pour lever l'ambiguïté.
Classification
- graphique
- flux › flux circulaires
- flux; Visual Vocabulary du Financial Times
- le nom évoque : objet
Canaux
 longueur; principal : volume de la relation (largeur de la corde à ses extrémités)
 inclinaison ou angle; principal : part de chaque entité (longueur d'arc)
 teinte; principal : nœud
Variantes
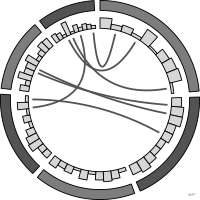 diagramme Circoscas particulier
Attestation
- terme français : Lagnel, Manuel de datavisualisation, Dunod, 2021
- définition anglaise : Data Visualisation Guide, data.europa.eu
Littérature scientifique
OpenAlex : 410 articles depuis 1997, dont 68 % ces cinq dernières années; surtout en Computer Science, Medicine, Social Sciences
Références séminales
- diffusion (2009) Krzywinski et al. (2009). Circos: an information aesthetic for comparative genomics. Genome Research (11 031 citations); Friendly & Denis 2001
Paquets R
- R
circlize::chordDiagram(); GitHub 1 028 étoiles; dernier commit 2023-11; article (4 288 citations) - R
ggchord2::geom_chord_diagram(); article (0 citations)
Code R de l'exemple ggplot2
library(ggplot2)
library(dplyr)
library(ggforce)
library(migest)
## Migrants between the five Italian macro-regions in 2000, all ages.
flows <- italy_area |>
filter(year == 2000, orig != dest) |>
group_by(orig, dest) |>
summarise(flow = sum(flow) / 1000, .groups = "drop")
regions <- c("North-West", "North-East", "Center", "South", "Islands")
## Each region gets an arc as long as its departures plus its arrivals,
## departures first; angles in radians, clockwise from the top (ggforce).
gap <- 0.06
scale <- (2 * pi - gap * length(regions)) / (2 * sum(flows$flow))
sectors <- tibble(region = regions) |>
mutate(out = sapply(region, \(r) sum(flows$flow[flows$orig == r])),
inn = sapply(region, \(r) sum(flows$flow[flows$dest == r])),
end = cumsum((out + inn) * scale + gap) - gap, start = end - (out + inn) * scale)
flows <- flows |>
mutate(orig = factor(orig, regions), dest = factor(dest, regions)) |>
arrange(orig, dest) |>
group_by(orig) |>
mutate(a2 = sectors$start[as.integer(orig)] + cumsum(flow) * scale, a1 = a2 - flow * scale) |>
arrange(dest, orig) |>
group_by(dest) |>
mutate(b2 = sectors$start[as.integer(dest)] + (sectors$out[as.integer(dest)] + cumsum(flow)) * scale,
b1 = b2 - flow * scale) |>
ungroup()
## A ribbon: the arc it leaves, a curve through the centre, the arc it
## reaches, a curve back.
arc <- function(from, to, r = 1) {
a <- seq(from, to, length.out = 20)
cbind(r * sin(a), r * cos(a))
}
bend <- function(p, q) {
t <- seq(0, 1, length.out = 30)
(1 - t)^2 %o% p + (t^2) %o% q
}
ribbons <- bind_rows(lapply(seq_len(nrow(flows)), function(i) {
f <- flows[i, ]
A <- arc(f$a1, f$a2)
B <- arc(f$b1, f$b2)
xy <- rbind(A, bend(A[20, ], B[1, ]), B, bend(B[20, ], A[1, ]))
tibble(id = i, orig = f$orig, x = xy[, 1], y = xy[, 2])
}))
p <- ggplot() +
geom_polygon(data = ribbons, aes(x = x, y = y, group = id, fill = orig), alpha = 0.65) +
geom_arc_bar(data = sectors, aes(x0 = 0, y0 = 0, r0 = 1.02, r = 1.1, start = start, end = end,
fill = factor(region, regions)), colour = NA) +
geom_text(data = sectors, aes(x = 1.22 * sin((start + end) / 2), y = 1.22 * cos((start + end) / 2),
label = region, hjust = ifelse(sin((start + end) / 2) > 0, 0, 1)),
size = 2.8, colour = "#262626") +
scale_fill_manual(values = setNames(lex_pal_discrete(5), regions)) +
coord_equal(xlim = c(-2.1, 2.1), ylim = c(-1.25, 1.25), clip = "off") +
labs(title = "The South sent the most migrants to other regions",
subtitle = "Moves between Italian regions in 2000, colored by origin",
x = NULL, y = NULL,
caption = "Data: ISTAT, via the migest R package") +
theme_lex_viz(grid = "", arrows = "") +
theme(legend.position = "none", axis.text = element_blank())Sources (23)
54 occurrences dans le corpus; indexé par 4 ouvrages
Afficher les 23 sources
- 100 diagrams that changed the world: from the earliest cave paintings to the innovation...
- app.flourish.studio
- Better data visualizations: a guide for scholars, researchers, and wonks
- Bremer & Barone, Chart, CRC Press, 2025
- Cartographies of Time
- Data sketches
- Data Visualisation Guide, data.europa.eu
- Data visualisation: a handbook for data driven design
- Data visualization handbook
- Data Viz Project
- data-to-viz.com
- datavizproject.com
- From data to viz
- Information graphics
- Information Graphics: A Comprehensive Illustrated Reference
- L’Atlas Molière
- Lagnel, Manuel de datavisualisation, Dunod, 2021
- Les fondamentaux de la visualisation de données
- Manuel de datavisualisation - 2e éd, vol. 2
- python-graph-gallery.com
- The book of circles: visualizing spheres of knowledge
- Visualizing with text
- Wikipedia in English↗
Citer cette fiche
Adresse stablehttps://dataviz.adrientaudiere.com/terme/chord-diagram.html
RéférenceTaudière Adrien. 2026. diagramme en accords. Dans Visualization Vocabulary, version 1.0.0. IdEst. https://dataviz.adrientaudiere.com/terme/chord-diagram.html
BibTeX
@incollection{taudiere2026-chord-diagram,
  author    = {Taudière, Adrien},
  title     = {diagramme en accords},
  booktitle = {Visualization Vocabulary},
  year      = {2026},
  version   = {1.0.0},
  publisher = {IdEst},
  url       = {https://dataviz.adrientaudiere.com/terme/chord-diagram.html},
  note      = {CC0 1.0}
}Fiche créée le 13/10/2026. Texte modifié le 02/11/2026. Images modifiées le 12/11/2026. Chiffres calculés le 22/10/2026.