
 graphique
diagramme Circos
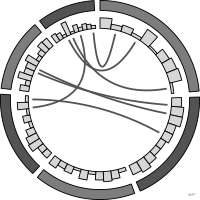
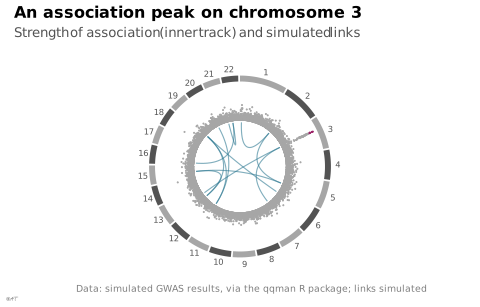
Relations entre régions génomiques disposées sur un cercle.
Circos plot
Relationships between genomic regions arranged around a circle.
Vérifié : « Circos plots of whole-genome sequence data » dans Visual Strategies for Biological Data.
Classification
- graphique
- radial › dispositions circulaires
- flux
Canaux
 longueur; principal : valeurs des pistes
 inclinaison ou angle; principal : position génomique (position angulaire)
 teinte; principal : chromosome ou catégorie
Attestation
Littérature scientifique
OpenAlex : 895 articles depuis 1896, dont 37 % ces cinq dernières années; surtout en Biochemistry, Genetics and Molecular Biology, Arts and Humanities, Medicine
Références séminales
- invention (2009) Krzywinski et al. (2009). Circos: An information aesthetic for comparative genomics. Genome Research (11 031 citations)
Paquets R
- R
circlize::circos.initialize(); GitHub 1 028 étoiles; dernier commit 2023-11; article (4 288 citations) - R
RCircos::RCircos.Chromosome.Ideogram.Plot(); GitHub 6 étoiles; dernier commit 2021-12; article (995 citations)
Code R de l'exemple ggplot2
library(ggplot2)
library(dplyr)
library(ggforce)
library(qqman)
## The 22 chromosomes on a circle, each arc as long as its number of SNPs;
## inside, a track of association strength, and links between regions.
## Angles in radians, clockwise from the top (ggforce).
gap <- 0.02
chromosomes <- gwasResults |>
count(CHR) |>
mutate(end = cumsum(n * (2 * pi - 22 * gap) / sum(n) + gap) - gap,
start = end - n * (2 * pi - 22 * gap) / sum(n),
shade = ifelse(CHR %% 2 == 0, "even", "odd"))
snps <- gwasResults |>
arrange(CHR, BP) |>
group_by(CHR) |>
mutate(rank = row_number()) |>
ungroup() |>
left_join(chromosomes, by = "CHR") |>
mutate(angle = start + (rank - 0.5) / n * (end - start),
r = 0.55 + 0.4 * -log10(P) / max(-log10(P)),
hit = P < 5e-8)
## Links between the strongest SNPs of two chromosomes: simulated, for the
## example.
set.seed(4)
top <- slice_min(group_by(snps, CHR), P, n = 1, with_ties = FALSE) |> ungroup()
pairs <- replicate(12, sample(nrow(top), 2))
links <- tibble(from = pairs[1, ], to = pairs[2, ])
link_points <- bind_rows(lapply(seq_len(nrow(links)), function(i) {
a <- top$angle[links$from[i]]
b <- top$angle[links$to[i]]
tibble(id = i, x = c(0.52 * sin(a), 0, 0.52 * sin(b)), y = c(0.52 * cos(a), 0, 0.52 * cos(b)))
}))
p <- ggplot() +
geom_bezier(data = link_points, aes(x = x, y = y, group = id), colour = "#2e7891",
alpha = 0.6, linewidth = 0.4) +
geom_point(data = snps, aes(x = r * sin(angle), y = r * cos(angle), colour = hit), size = 0.15) +
geom_arc_bar(data = chromosomes, aes(x0 = 0, y0 = 0, r0 = 1, r = 1.07, start = start, end = end,
fill = shade), colour = NA) +
geom_text(data = chromosomes, aes(x = 1.15 * sin((start + end) / 2), y = 1.15 * cos((start + end) / 2),
label = CHR), size = 2.2, colour = "#535353") +
scale_fill_manual(values = c(odd = "#a6a6a6", even = "#535353"), guide = "none") +
scale_colour_manual(values = c(`FALSE` = "#a6a6a6", `TRUE` = "#9b2367"), guide = "none") +
coord_equal(xlim = c(-2, 2), ylim = c(-1.2, 1.2), clip = "off") +
labs(title = "An association peak on chromosome 3",
subtitle = "Strength of association (inner track) and simulated links",
x = NULL, y = NULL,
caption = "Data: simulated GWAS results, via the qqman R package; links simulated") +
theme_lex_viz(grid = "", arrows = "") +
theme(axis.text = element_blank())Sources (2)
Citer cette fiche
Adresse stablehttps://dataviz.adrientaudiere.com/terme/circos-plot.html
RéférenceTaudière Adrien. 2026. diagramme Circos. Dans Visualization Vocabulary, version 1.0.0. IdEst. https://dataviz.adrientaudiere.com/terme/circos-plot.html
BibTeX
@incollection{taudiere2026-circos-plot,
  author    = {Taudière, Adrien},
  title     = {diagramme Circos},
  booktitle = {Visualization Vocabulary},
  year      = {2026},
  version   = {1.0.0},
  publisher = {IdEst},
  url       = {https://dataviz.adrientaudiere.com/terme/circos-plot.html},
  note      = {CC0 1.0}
}Fiche créée le 13/10/2026. Texte modifié le 02/11/2026. Images modifiées le 12/11/2026. Chiffres calculés le 22/10/2026.