
 graphique
 des coefficients
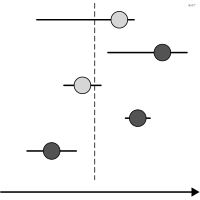
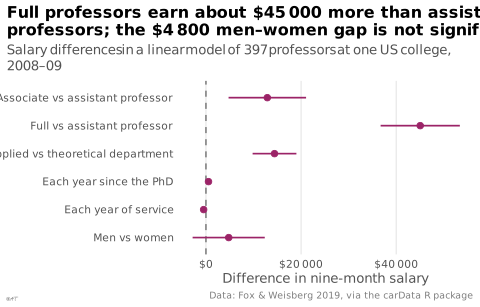
aussi : graphique points-moustachesCoefficients d'un modèle et leurs intervalles alignés sur un axe commun.
coefficient plot
also: dot-whisker plotModel coefficients and their intervals aligned on a common axis.
Remplace avantageusement le tableau de régression dans un article.
Classification
- graphique
- points et bulles › points et intervalles
- grandeur
- le nom évoque : nature
Canaux
 position sur une échelle commune; principal : estimation
 longueur; principal : intervalle de confiance
 région de l'espace; principal : variable
Variantes
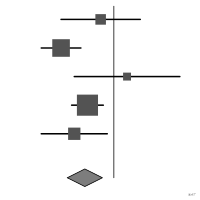 graphique en forêtméta-analyse
Attestation
Littérature scientifique
OpenAlex : 285 articles depuis 1975, dont 42 % ces cinq dernières années; surtout en Engineering, Medicine, Chemistry
Paquets R
- R
dotwhisker::dwplot(); GitHub 59 étoiles; dernier commit 2026-06 - R
ggstats::ggcoef_model(); GitHub 56 étoiles; dernier commit 2026-09
Code R de l'exemple ggplot2
library(ggplot2)
library(carData)
## Linear model of the 2008-09 nine-month salaries of US professors; each
## coefficient with its 95% interval, other variables held constant.
model <- lm(salary ~ rank + discipline + yrs.since.phd + yrs.service + sex, data = Salaries)
terms <- c(rankAssocProf = "Associate vs assistant professor", rankProf = "Full vs assistant professor",
disciplineB = "Applied vs theoretical department", yrs.since.phd = "Each year since the PhD",
yrs.service = "Each year of service", sexMale = "Men vs women")
coefs <- data.frame(term = terms[names(coef(model))[-1]], estimate = coef(model)[-1],
confint(model)[-1, ], check.names = FALSE)
names(coefs)[3:4] <- c("low", "high")
coefs$term <- factor(coefs$term, levels = rev(terms))
p <- ggplot(coefs, aes(x = estimate, y = term)) +
geom_vline(xintercept = 0, colour = "#535353", linewidth = 0.4, linetype = "dashed") +
geom_errorbar(aes(xmin = low, xmax = high), width = 0, orientation = "y", colour = "#9b2367",
linewidth = 0.6) +
geom_point(size = 2, colour = "#9b2367") +
scale_x_continuous(labels = \(x) paste0("$", lex_number(x))) +
labs(title = "Full professors earn about $45 000 more than assistant\nprofessors; the $4 800 men–women gap is not significant",
subtitle = "Salary differences in a linear model of 397 professors at one US college, 2008–09",
x = "Difference in nine-month salary", y = NULL,
caption = "Data: Fox & Weisberg 2019, via the carData R package") +
theme_lex_viz(grid = "x", arrows = "")Sources (3)
1 occurrence dans le corpus
Citer cette fiche
Adresse stablehttps://dataviz.adrientaudiere.com/terme/coefficient-plot.html
RéférenceTaudière Adrien. 2026. graphique des coefficients. Dans Visualization Vocabulary, version 1.0.0. IdEst. https://dataviz.adrientaudiere.com/terme/coefficient-plot.html
BibTeX
@incollection{taudiere2026-coefficient-plot,
  author    = {Taudière, Adrien},
  title     = {graphique des coefficients},
  booktitle = {Visualization Vocabulary},
  year      = {2026},
  version   = {1.0.0},
  publisher = {IdEst},
  url       = {https://dataviz.adrientaudiere.com/terme/coefficient-plot.html},
  note      = {CC0 1.0}
}Fiche créée le 13/10/2026. Texte modifié le 02/11/2026. Images modifiées le 12/11/2026. Chiffres calculés le 22/10/2026.