
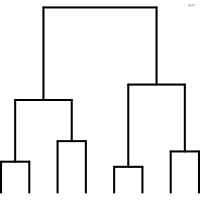
 graphique
dendrogramme
aussi : arbreArbre représentant une classification hiérarchique.
dendrogram
also: tree diagramTree showing a hierarchical classification.
Classification
- graphique
- réseaux et arbres › arbres binaires
- le nom évoque : nature
Canaux
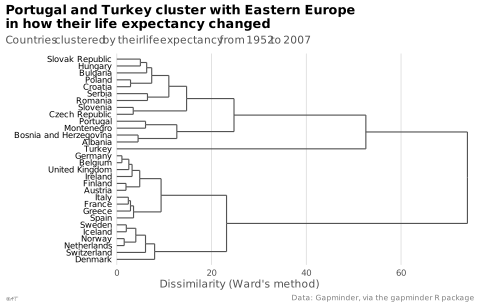
 position sur une échelle commune; principal : hauteur de fusion; Munzner 2014
 longueur; secondaire : distance entre les nœuds; Munzner 2014
 région de l'espace; secondaire : ordre des feuilles; Munzner 2014
Variantes
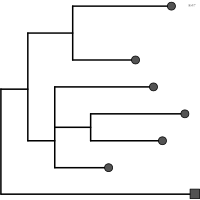 arbre phylogénétiquelongueur des branches
Attestation
- terme français : Bertin, Sémiologie graphique, 1967
- définition anglaise : Data Visualisation Guide, data.europa.eu
Littérature scientifique
OpenAlex : 21 165 articles depuis 1963, dont 22 % ces cinq dernières années; surtout en Biochemistry, Genetics and Molecular Biology, Agricultural and Biological Sciences, Medicine; Wikidata
Références séminales
- formalisation (1957) Michener & Sokal (1957). A Quantitative Approach to a Problem in Classification. Evolution (637 citations)
Paquets R
- R
ggtree::ggtree(); GitHub 935 étoiles; dernier commit 2026-10; article (4 860 citations) Bioconductor. - R
dendextend::color_branches(); GitHub 161 étoiles; dernier commit 2025-07; article (1 826 citations) - R
ggdendro::ggdendrogram(); GitHub 90 étoiles; dernier commit 2025-11 - R
dendsort::dendsort(); GitHub 5 étoiles; dernier commit 2021-05; article (73 citations) Ordonne les feuilles d'un dendrogramme, ne le dessine pas.
Code R de l'exemple ggplot2
library(ggplot2)
library(dplyr)
library(tidyr)
library(gapminder)
library(ggdendro)
## One row per country, one column per year of life expectancy.
europe <- gapminder |>
filter(continent == "Europe") |>
select(country, year, lifeExp) |>
pivot_wider(names_from = year, values_from = lifeExp)
trajectories <- as.matrix(europe[, -1])
rownames(trajectories) <- europe$country
tree <- dendro_data(hclust(dist(trajectories), method = "ward.D2"))
p <- ggplot() +
geom_segment(data = segment(tree), aes(x = y, y = x, xend = yend, yend = xend),
colour = "#535353", linewidth = 0.4) +
geom_text(data = label(tree), aes(x = -1, y = x, label = label), hjust = 1, size = 2.2) +
scale_x_continuous(labels = lex_number, breaks = \(l) scales::breaks_extended()(c(0, l[2])),
expand = expansion(mult = c(0.3, 0.02))) +
scale_y_continuous(NULL, breaks = NULL, expand = expansion(add = 0.8)) +
labs(title = "Portugal and Turkey cluster with Eastern Europe\nin how their life expectancy changed",
subtitle = "Countries clustered by their life expectancy from 1952 to 2007",
x = "Dissimilarity (Ward's method)",
caption = "Data: Gapminder, via the gapminder R package") +
theme_lex_viz(base_size = 8, grid = "x", arrows = "")Sources (49)
297 occurrences dans le corpus; indexé par 5 ouvrages
Afficher les 49 sources
- app.flourish.studio
- Applied Multivariate Statistics in R
- Atlas of knowledge: anyone can map
- Bertin, Sémiologie graphique, 1967
- Better data visualizations: a guide for scholars, researchers, and wonks
- Cartographies of Time
- Computational statistics in data science
- Cook & Laa, Interactively Exploring High-Dimensional Data and Models in R, Chapman & Hall/CRC, 2026
- Data Visualisation Guide, data.europa.eu
- Data visualisation: a handbook for data driven design
- Data visualization handbook
- Data Viz Project
- data-to-viz.com
- datavizproject.com
- Design for information: an introduction to the histories, theories, and best practices ...
- Fiches de biostatistique du PBIL (Chessel, Dufour, Thioulouse et al., Lyon 1)
- From data to viz
- Graphics for learning: proven guidelines for planning, designing, and evaluating visual...
- Grosjean & Engels, Science des données biologiques I-III (Université de Mons)
- Handling and mapping geographic information
- Information graphics
- Information Graphics: A Comprehensive Illustrated Reference
- Information theory tools for visualization
- La graphique et le traitement graphique de l'information
- Larmarange et al., analyse-R : introduction à l'analyse d'enquêtes avec R
- Larmarange, guide-R : guide pour l'analyse de données d'enquêtes avec R
- Les fondamentaux de la visualisation de données
- Making and Breaking the Grid, Third Edition
- Manuel de datavisualisation - 2e éd, vol. 2
- python-graph-gallery.com
- Rakotomalala, fascicules de cours de statistique (Université Lyon 2)
- Semiologie graphique: les diagrammes, les réseaux, les cartes.
- Semiology of graphics: diagrams, networks, maps
- Série d'ateliers R du CSBQ, version française (Centre de la science de la biodiversité du Québec)
- The book of circles: visualizing spheres of knowledge
- The book of trees: visualizing branches of knowledge
- The golden age of data visualization: how did we get here?
- The Oxford Handbook of Empirical Aesthetics
- Thematic Cartography and Geovisualization
- Visual complexity: mapping patterns of information
- Visualization Analysis and Design
- Visualization of Time-Oriented Data
- Visualize This
- Visualizing Uncertainty About the Future
- Visualizing with text
- Wikipedia — Data and information visualization
- Wikipédia — Visualisation de données
- Wikipédia en français↗
- Wikipedia in English↗
Citer cette fiche
Adresse stablehttps://dataviz.adrientaudiere.com/terme/dendrogram.html
RéférenceTaudière Adrien. 2026. dendrogramme. Dans Visualization Vocabulary, version 1.0.0. IdEst. https://dataviz.adrientaudiere.com/terme/dendrogram.html
BibTeX
@incollection{taudiere2026-dendrogram,
  author    = {Taudière, Adrien},
  title     = {dendrogramme},
  booktitle = {Visualization Vocabulary},
  year      = {2026},
  version   = {1.0.0},
  publisher = {IdEst},
  url       = {https://dataviz.adrientaudiere.com/terme/dendrogram.html},
  note      = {CC0 1.0}
}Fiche créée le 13/10/2026. Texte modifié le 12/11/2026. Images modifiées le 12/11/2026. Chiffres calculés le 22/10/2026.