

 graphique
diagramme en points
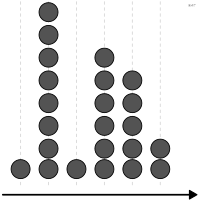
aussi : graphique à pointsDistribution où chaque observation est un point empilé au-dessus de sa valeur.
dot plot
Distribution in which each observation is a dot stacked above its value.
Forme de Wilkinson (1999). Le diagramme en points de Cleveland (cleveland-dot-plot) aligne un point par catégorie.
Classification
- graphique
- points et bulles › bandes de points
- distribution
Canaux
 position sur une échelle commune; principal : valeur de l'observation (abscisse)
 longueur; secondaire : effectif de la classe (hauteur de la pile de points)
 région de l'espace; secondaire : classe
Variantes
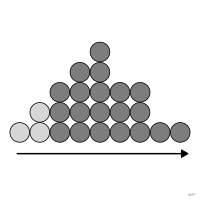 diagramme en points de quantilesquantiles
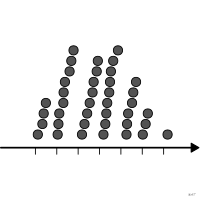 graphique en épisvaleur exacte dans la classe
Attestation
- terme français : Usage courant, non attesté par une source
Littérature scientifique
OpenAlex : 2 295 articles depuis 1977, dont 49 % ces cinq dernières années; surtout en Medicine, Biochemistry, Genetics and Molecular Biology, Immunology and Microbiology
Références séminales
- formalisation (1999) Wilkinson (1999). Dot Plots. The American Statistician (82 citations)
Paquets R
- R
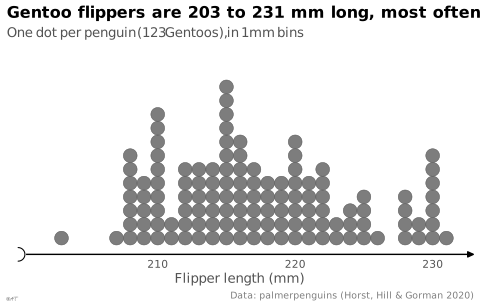
ggplot2::geom_dotplot(); GitHub 7 025 étoiles; dernier commit 2026-10; article (33 455 citations) Dot plot de Wilkinson : points empilés par classe.
Code R de l'exemple ggplot2
library(ggplot2)
library(dplyr)
library(palmerpenguins)
gentoo <- penguins |>
filter(species == "Gentoo")
p <- ggplot(gentoo, aes(x = flipper_length_mm)) +
geom_dotplot(binwidth = 1, fill = "#7d7d7d", colour = "#535353",
stroke = 0.5, na.rm = TRUE) +
scale_x_continuous(labels = lex_number, breaks = lex_break_breaks, expand = lex_break_expand) +
scale_y_continuous(NULL, breaks = NULL) +
labs(title = "Gentoo flippers are 203 to 231 mm long, most often 215 mm",
subtitle = "One dot per penguin (123 Gentoos), in 1 mm bins",
x = "Flipper length (mm)",
caption = "Data: palmerpenguins (Horst, Hill & Gorman 2020)") +
theme_lex_viz(grid = "", arrows = "x", break_not_zero = "x")Sources (35)
263 occurrences dans le corpus; indexé par 11 ouvrages
Afficher les 35 sources
- analysisfunction.civilservice.gov.uk
- app.flourish.studio
- Better data visualizations: a guide for scholars, researchers, and wonks
- cedricscherer.com↗
- Computational statistics in data science
- Data points: visualization that means something
- Data Visualisation Guide, data.europa.eu
- Data visualisation: a handbook for data driven design
- Data visualization handbook
- Data Viz Project
- data-to-viz.com
- datavizproject.com
- datawrapper.de↗
- Effective data storytelling: how to drive change with data, narrative, and visuals
- Effective data visualization: the right chart for the right data
- Friendly & Wainer, A History of Data Visualization and Graphic Communication, Harvard University Press, 2021
- From data to viz
- Information theory tools for visualization
- Larmarange et al., analyse-R : introduction à l'analyse d'enquêtes avec R
- LibreTexts Statistics, chapitres de manuels sur les figures
- More Practical Charts
- Open Visualization Academy, cours et lettre d'information (Cairo et al.)
- Practical charts: the essential guide to creating clear, compelling charts for reports ...
- Show me the numbers: designing tables and graphs to enlighten
- Storytelling with data: let's practice!
- The big book of dashboards: visualizing your data using real-world business scenarios
- The grammar of graphics
- Thematic Cartography and Geovisualization
- Visual strategies for biological data
- Visualization Analysis and Design
- Visualize This
- Wickham, Navarro & Pedersen, ggplot2: Elegant Graphics for Data Analysis, 3e éd. en ligne↗
- Wikipedia — Data and information visualization
- Wikipedia in English↗
- Wilke, Fundamentals of Data Visualization, O'Reilly, 2019
Citer cette fiche
Adresse stablehttps://dataviz.adrientaudiere.com/terme/dot-plot.html
RéférenceTaudière Adrien. 2026. diagramme en points. Dans Visualization Vocabulary, version 1.0.0. IdEst. https://dataviz.adrientaudiere.com/terme/dot-plot.html
BibTeX
@incollection{taudiere2026-dot-plot,
  author    = {Taudière, Adrien},
  title     = {diagramme en points},
  booktitle = {Visualization Vocabulary},
  year      = {2026},
  version   = {1.0.0},
  publisher = {IdEst},
  url       = {https://dataviz.adrientaudiere.com/terme/dot-plot.html},
  note      = {CC0 1.0}
}Fiche créée le 13/10/2026. Texte modifié le 22/10/2026. Images modifiées le 12/11/2026. Chiffres calculés le 22/10/2026.