
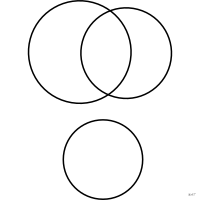

 graphique
diagramme d'Euler
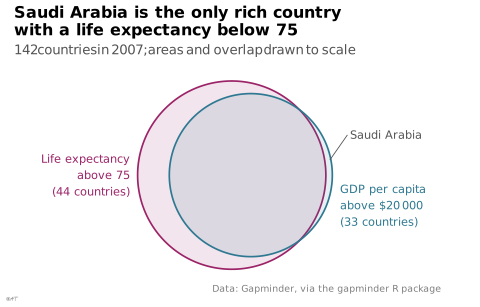
Ensembles dont seules les intersections réelles sont dessinées.
Euler diagram
Sets where only the actual intersections are drawn.
Classification
- graphique
- ensembles › diagrammes d'ensembles
- partie d'un tout
- le nom évoque : nom de personne
Canaux
 aire; secondaire : taille de l'ensemble (variante proportionnelle)
 région de l'espace; principal : ensembles et intersections
 teinte; secondaire : ensemble
Variantes
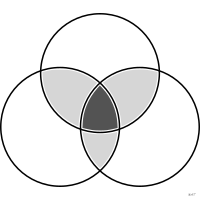 diagramme de Venntoutes les intersections
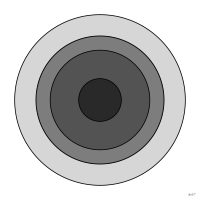 diagramme en oignonemboîté
Attestation
- terme français : Wikipédia en français↗
Littérature scientifique
OpenAlex : 425 articles depuis 1981, dont 20 % ces cinq dernières années; surtout en Computer Science, Social Sciences, Mathematics; Wikidata
Références séminales
- nom (1768) Euler (1768). Lettres à une princesse d'Allemagne; Wikipedia in English
Paquets R
- R
eulerr::euler(); GitHub 151 étoiles; dernier commit 2026-10 - R
VennDiagram::venn.diagram(); GitHub 8 étoiles; dernier commit 2026-01; article (3 158 citations) Diagramme d'Euler par l'argument euler.d.
Code R de l'exemple ggplot2
library(ggplot2)
library(dplyr)
library(ggforce)
library(gapminder)
## Two sets of countries in 2007, drawn as circles whose areas are their
## sizes and whose overlap is the size of their intersection.
countries <- gapminder |>
filter(year == 2007) |>
mutate(long = lifeExp > 75, rich = gdpPercap > 20000)
n_long <- sum(countries$long)
n_rich <- sum(countries$rich)
n_both <- sum(countries$long & countries$rich)
r_long <- sqrt(n_long / pi)
r_rich <- sqrt(n_rich / pi)
## Area of the lens shared by two circles whose centres are d apart.
lens <- function(d, r1, r2) {
r1^2 * acos((d^2 + r1^2 - r2^2) / (2 * d * r1)) + r2^2 * acos((d^2 + r2^2 - r1^2) / (2 * d * r2)) -
0.5 * sqrt((-d + r1 + r2) * (d + r1 - r2) * (d - r1 + r2) * (d + r1 + r2))
}
d <- uniroot(\(d) lens(d, r_long, r_rich) - n_both,
c(abs(r_long - r_rich) + 1e-9, r_long + r_rich - 1e-9))$root
circles <- tibble(set = c("long", "rich"), x = c(0, d), r = c(r_long, r_rich))
p <- ggplot(circles) +
geom_circle(aes(x0 = x, y0 = 0, r = r, colour = set, fill = set), alpha = 0.12, linewidth = 0.6) +
annotate("text", x = -r_long - 0.3, y = 0, hjust = 1, size = 3, colour = "#9b2367",
label = paste0("Life expectancy\nabove 75\n(", n_long, " countries)")) +
annotate("text", x = d + r_rich + 0.3, y = -1.2, hjust = 0, size = 3, colour = "#2e7891",
label = paste0("GDP per capita\nabove $20 000\n(", n_rich, " countries)")) +
## The thin crescent of the rich circle outside the other one: Saudi Arabia.
annotate("segment", x = d + r_rich - 0.1, y = 0.6, xend = d + r_rich + 0.6, yend = 1.6,
colour = "#535353", linewidth = 0.3) +
annotate("text", x = d + r_rich + 0.7, y = 1.6, hjust = 0, size = 3, colour = "#535353",
label = "Saudi Arabia") +
scale_colour_manual(values = c(long = "#9b2367", rich = "#2e7891")) +
scale_fill_manual(values = c(long = "#9b2367", rich = "#2e7891")) +
coord_fixed(xlim = c(-r_long - 3.2, d + r_rich + 3.6)) +
labs(title = "Saudi Arabia is the only rich country\nwith a life expectancy below 75",
subtitle = "142 countries in 2007; areas and overlap drawn to scale",
x = NULL, y = NULL,
caption = "Data: Gapminder, via the gapminder R package") +
theme_lex_viz(grid = "", arrows = "") +
theme(legend.position = "none", axis.text = element_blank())Sources (11)
14 occurrences dans le corpus; indexé par 3 ouvrages
Afficher les 11 sources
- Brilliant Maps for Curious Minds: 100 New Ways to See the World (Maps for Curious Minds)
- Data visualisation: a handbook for data driven design
- Data visualization handbook
- Data Viz Project
- datavizproject.com
- The book of circles: visualizing spheres of knowledge
- The golden age of data visualization: how did we get here?
- Visual strategies for biological data
- Visualizing with text
- Wikipédia en français↗
- Wikipedia in English↗
Citer cette fiche
Adresse stablehttps://dataviz.adrientaudiere.com/terme/euler-diagram.html
RéférenceTaudière Adrien. 2026. diagramme d'Euler. Dans Visualization Vocabulary, version 1.0.0. IdEst. https://dataviz.adrientaudiere.com/terme/euler-diagram.html
BibTeX
@incollection{taudiere2026-euler-diagram,
  author    = {Taudière, Adrien},
  title     = {diagramme d'Euler},
  booktitle = {Visualization Vocabulary},
  year      = {2026},
  version   = {1.0.0},
  publisher = {IdEst},
  url       = {https://dataviz.adrientaudiere.com/terme/euler-diagram.html},
  note      = {CC0 1.0}
}Fiche créée le 13/10/2026. Texte modifié le 12/11/2026. Images modifiées le 12/11/2026. Chiffres calculés le 22/10/2026.