


 graphique
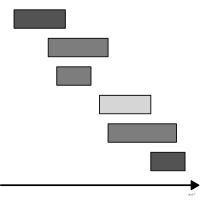
diagramme de Gantt
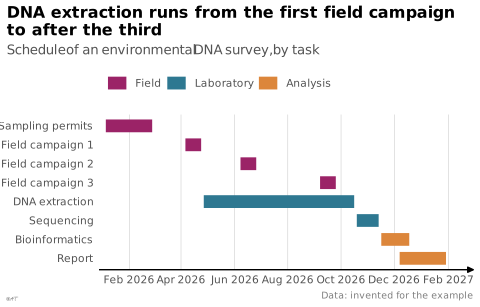
Barres horizontales situant des tâches dans le temps.
Gantt chart
also: progress chartHorizontal bars placing tasks along a timeline.
Classification
- graphique
- chronologies
- évolution dans le temps
- le nom évoque : nom de personne
Canaux
 position sur une échelle commune; principal : début et fin
 longueur; principal : durée
 région de l'espace; principal : tâche
 teinte; secondaire : catégorie
Attestation et synonymies
- terme français : Lagnel, Manuel de datavisualisation, Dunod, 2021
- définition anglaise : Brinton, Graphic Presentation, 1939↗
- progress chart; Brinton, Graphic Presentation, 1939↗
Littérature scientifique
OpenAlex : 2 190 articles depuis 1938, dont 31 % ces cinq dernières années; surtout en Decision Sciences, Engineering, Computer Science; Wikidata
Références séminales
Paquets R
- R
vistime::gg_vistime(); GitHub 175 étoiles; dernier commit 2026-03
Code R de l'exemple ggplot2
library(ggplot2)
library(dplyr)
## An invented schedule: an environmental DNA survey over one year, from the
## permits to the report.
tasks <- tribble(
~task, ~phase, ~start, ~end,
"Sampling permits", "Field", "2026-01-05", "2026-02-27",
"Field campaign 1", "Field", "2026-04-06", "2026-04-24",
"Field campaign 2", "Field", "2026-06-08", "2026-06-26",
"Field campaign 3", "Field", "2026-09-07", "2026-09-25",
"DNA extraction", "Laboratory", "2026-04-27", "2026-10-16",
"Sequencing", "Laboratory", "2026-10-19", "2026-11-13",
"Bioinformatics", "Analysis", "2026-11-16", "2026-12-18",
"Report", "Analysis", "2026-12-07", "2027-01-29"
) |>
mutate(across(c(start, end), as.Date),
task = factor(task, levels = rev(task)),
phase = factor(phase, levels = c("Field", "Laboratory", "Analysis")))
p <- ggplot(tasks, aes(y = task, colour = phase)) +
geom_segment(aes(x = start, xend = end), linewidth = 4.5) +
scale_colour_manual(values = unname(lex_colors), name = NULL) +
scale_x_date(date_breaks = "2 months", labels = scales::label_date("%b %Y", locale = "en"),
expand = expansion(mult = c(0.02, 0.08))) +
labs(title = "DNA extraction runs from the first field campaign\nto after the third",
subtitle = "Schedule of an environmental DNA survey, by task",
x = NULL, y = NULL,
caption = "Data: invented for the example") +
theme_lex_viz(grid = "x", arrows = "x")Sources (24)
88 occurrences dans le corpus; indexé par 7 ouvrages
Afficher les 24 sources
- app.flourish.studio
- Better data visualizations: a guide for scholars, researchers, and wonks
- Brinton, Graphic Presentation, 1939↗
- Data visualisation: a handbook for data driven design
- Data Viz Project
- Data-driven storytelling
- datavizcatalogue.com
- datavizproject.com
- datawrapper.de↗
- Exploratory Data Analysis: Descriptive Analysis, Visualization, and Dashboard Design (w...
- Graphic presentation
- Info we trust: how to inspire the world with data
- Information Graphics: A Comprehensive Illustrated Reference
- Interactive data visualization: foundations, techniques, and applications
- Lagnel, Manuel de datavisualisation, Dunod, 2021
- Les fondamentaux de la visualisation de données
- Manuel de datavisualisation - 2e éd, vol. 2
- Milestones in the history of thematic cartography, statistical graphics, and data visua...
- The big book of dashboards: visualizing your data using real-world business scenarios
- The grammar of graphics
- Visualization of Time-Oriented Data
- Wikipedia — Data and information visualization
- Wikipédia en français↗
- Wikipedia in English↗
Citer cette fiche
Adresse stablehttps://dataviz.adrientaudiere.com/terme/gantt-chart.html
RéférenceTaudière Adrien. 2026. diagramme de Gantt. Dans Visualization Vocabulary, version 1.0.0. IdEst. https://dataviz.adrientaudiere.com/terme/gantt-chart.html
BibTeX
@incollection{taudiere2026-gantt-chart,
  author    = {Taudière, Adrien},
  title     = {diagramme de Gantt},
  booktitle = {Visualization Vocabulary},
  year      = {2026},
  version   = {1.0.0},
  publisher = {IdEst},
  url       = {https://dataviz.adrientaudiere.com/terme/gantt-chart.html},
  note      = {CC0 1.0}
}Fiche créée le 13/10/2026. Texte modifié le 10/11/2026. Images modifiées le 12/11/2026. Chiffres calculés le 22/10/2026.