

 graphique
pictogramme
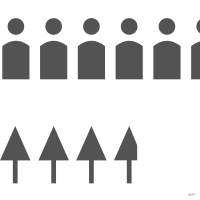
Icône répétée ou stylisée codant une quantité ou une catégorie.
pictogram
Repeated or stylized icon encoding a quantity or category.
Classification
- graphique
- secteurs, pavages et unités › unités
- grandeur; Visual Vocabulary du Financial Times
Canaux


Attestation
- terme français : Lagnel, Manuel de datavisualisation, Dunod, 2021
Littérature scientifique
Références séminales
- premier usage connu (1884) Mulhall (1884). Dictionary of Statistics; Friendly & Denis 2001, Andrews 2017
- diffusion (1914) Brinton (1914). Graphic Methods for Presenting Facts. The Engineering Magazine Company; Friendly & Denis 2001
Paquets R
- R
waffle::geom_pictogram(); GitHub 798 étoiles; dernier commit 2023-09 Retiré du CRAN : à installer depuis GitHub.
Code R de l'exemple ggplot2
library(ggplot2)
library(dplyr)
library(ggforce)
library(palmerpenguins)
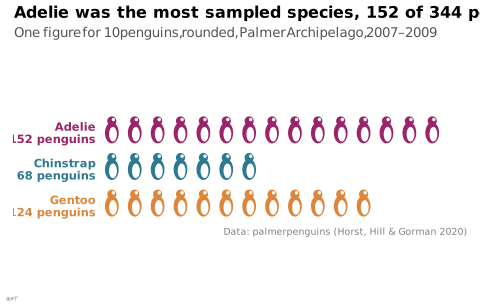
## One penguin figure for ten penguins sampled, rounded to the nearest
## figure: body and head in the species' colour, a white belly and eye.
figures <- penguins |>
count(species) |>
mutate(figures = round(n / 10), row = 1.6 * rev(seq_along(species)),
label = paste0(species, "\n", n, " penguins"))
icons <- figures |>
rowwise() |>
reframe(species = species, y = row, x = seq_len(figures))
beaks <- icons |>
rowwise() |>
reframe(species = species, x = x + c(0.17, 0.36, 0.17), y = y + c(0.6, 0.53, 0.47),
id = paste(species, x))
p <- ggplot(icons) +
geom_ellipse(aes(x0 = x, y0 = y, a = 0.3, b = 0.46, angle = 0, fill = species), colour = NA) +
geom_circle(aes(x0 = x, y0 = y + 0.52, r = 0.2, fill = species), colour = NA) +
geom_ellipse(aes(x0 = x + 0.05, y0 = y - 0.06, a = 0.17, b = 0.32, angle = 0), fill = "white", colour = NA) +
geom_point(aes(x = x + 0.07, y = y + 0.58), colour = "white", size = 0.6) +
geom_polygon(data = beaks, aes(x = x, y = y, group = id), fill = "#535353") +
geom_text(data = figures, aes(x = 0.3, y = row, label = label, colour = species),
hjust = 1, size = 3, lineheight = 0.9, fontface = "bold") +
scale_x_continuous(limits = c(-2.4, 15.6)) +
coord_equal() +
labs(title = "Adelie was the most sampled species, 152 of 344 penguins",
subtitle = "One figure for 10 penguins, rounded, Palmer Archipelago, 2007–2009",
x = NULL, y = NULL,
caption = "Data: palmerpenguins (Horst, Hill & Gorman 2020)") +
theme_lex_viz(grid = "", arrows = "") +
theme(legend.position = "none", axis.text = element_blank())Sources (31)
108 occurrences dans le corpus; indexé par 9 ouvrages
Afficher les 31 sources
- 100 diagrams that changed the world: from the earliest cave paintings to the innovation...
- app.flourish.studio
- Atlas of knowledge: anyone can map
- Cartography: thematic map design
- Data visualisation: a handbook for data driven design
- Data visualization handbook
- Data-driven storytelling
- datawrapper.de↗
- Design for information: an introduction to the histories, theories, and best practices ...
- Effective data visualization: the right chart for the right data
- Giraud & Pecout, Géomatique et cartographie avec R
- Graphic presentation
- Graphiques : vocabulaire, EBSI Montréal (d'après le GDT)↗
- Information Graphics: A Comprehensive Illustrated Reference
- Lagarenne, Minodier & Samson, « Comment présenter nos données pour mieux communiquer ? La datavisualisation : synthèse et simplicité », Courrier des statistiques n° 10 (Insee), 2023↗
- Lagnel, Manuel de datavisualisation, Dunod, 2021
- Les fondamentaux de la visualisation de données
- Magrit, manuel d'utilisation (UAR RIATE, CNRS)
- Making and Breaking the Grid, Third Edition
- Manuel de datavisualisation - 2e éd, vol. 2
- Milestones in the history of thematic cartography, statistical graphics, and data visua...
- Open Visualization Academy, cours et lettre d'information (Cairo et al.)
- RGAA, référentiel général d'amélioration de l'accessibilité : glossaire, critères et tests
- The book of circles: visualizing spheres of knowledge
- The functional art: an introduction to information graphics and visualization
- The Oxford Handbook of Empirical Aesthetics
- The Wall Street journal guide to information graphics: the dos and don'ts of presenting...
- wiki.wordsoftype.com
- Wikipedia — Data and information visualization
- Wikipédia en français↗
- Wikipedia in English↗
Citer cette fiche
Adresse stablehttps://dataviz.adrientaudiere.com/terme/pictogram.html
RéférenceTaudière Adrien. 2026. pictogramme. Dans Visualization Vocabulary, version 1.0.0. IdEst. https://dataviz.adrientaudiere.com/terme/pictogram.html
BibTeX
@incollection{taudiere2026-pictogram,
  author    = {Taudière, Adrien},
  title     = {pictogramme},
  booktitle = {Visualization Vocabulary},
  year      = {2026},
  version   = {1.0.0},
  publisher = {IdEst},
  url       = {https://dataviz.adrientaudiere.com/terme/pictogram.html},
  note      = {CC0 1.0}
}Fiche créée le 13/10/2026. Texte modifié le 06/11/2026. Images modifiées le 11/11/2026. Chiffres calculés le 22/10/2026.