
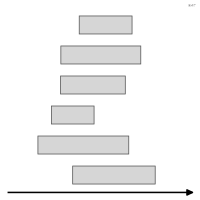
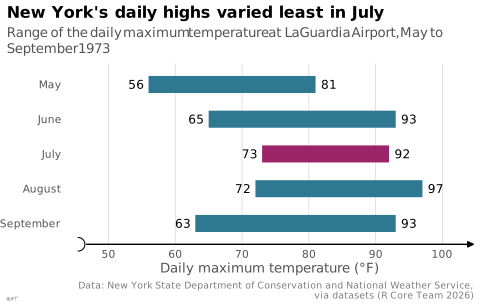
 graphique
diagramme en barres flottantes
aussi : barres d'étendueBarres qui vont, pour chaque catégorie, d'une valeur basse à une valeur haute, sans partir de zéro.
range bar chart
also: range bars, floating bar chartBars that run, for each category, from a low value to a high value rather than from zero.
Few (Show Me the Numbers) voit dans la boîte d'une boîte à moustaches une barre d'étendue, qui code une plage de valeurs ; le graphique en chandeliers en est un cas particulier.
Classification
- graphique
- barres › barres d'étendue et de repère
- distribution, écart
Canaux
 position sur une échelle commune; principal : valeur basse et valeur haute
 longueur; secondaire : étendue
Variantes
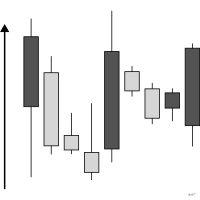 graphique en chandeliersquatre valeurs par période
Attestation
- terme français : Usage courant, non attesté par une source
- définition anglaise : Show me the numbers: designing tables and graphs to enlighten
Code R de l'exemple ggplot2
library(ggplot2)
library(dplyr)
## One bar per month, from the lowest to the highest daily maximum
## temperature: the bar floats, it does not start at zero.
ranges <- airquality |>
group_by(Month) |>
summarise(low = min(Temp), high = max(Temp)) |>
mutate(month = factor(month.name[Month], levels = month.name[5:9]),
narrowest = high - low == min(high - low))
p <- ggplot(ranges, aes(y = month)) +
geom_linerange(aes(xmin = low, xmax = high, colour = narrowest), linewidth = 6) +
geom_text(aes(x = low, label = low), hjust = 1, nudge_x = -0.8, size = 3.2) +
geom_text(aes(x = high, label = high), hjust = 0, nudge_x = 0.8, size = 3.2) +
scale_colour_manual(values = c(`FALSE` = lex_colors[["blue"]], `TRUE` = lex_colors[["plum"]]),
guide = "none") +
scale_y_discrete(limits = rev) +
scale_x_continuous(limits = c(50, 102), breaks = seq(50, 100, 10), expand = lex_break_expand) +
labs(title = "New York's daily highs varied least in July",
subtitle = "Range of the daily maximum temperature at LaGuardia Airport,\nMay to September 1973",
x = "Daily maximum temperature (°F)", y = NULL,
caption = "Data: New York State Department of Conservation and National Weather Service,\nvia datasets (R Core Team 2026)") +
theme_lex_viz(grid = "x", arrows = "x", break_not_zero = "x")Sources (8)
25 occurrences dans le corpus; indexé par 4 ouvrages
- Data visualisation: a handbook for data driven design
- Data visualization handbook
- Graphic presentation
- Information Graphics: A Comprehensive Illustrated Reference
- Milestones in the history of thematic cartography, statistical graphics, and data visua...
- Show me the numbers: designing tables and graphs to enlighten
- The grammar of graphics
- Visualizing with text
Citer cette fiche
Adresse stablehttps://dataviz.adrientaudiere.com/terme/range-bar-chart.html
RéférenceTaudière Adrien. 2026. diagramme en barres flottantes. Dans Visualization Vocabulary, version 1.0.0. IdEst. https://dataviz.adrientaudiere.com/terme/range-bar-chart.html
BibTeX
@incollection{taudiere2026-range-bar-chart,
  author    = {Taudière, Adrien},
  title     = {diagramme en barres flottantes},
  booktitle = {Visualization Vocabulary},
  year      = {2026},
  version   = {1.0.0},
  publisher = {IdEst},
  url       = {https://dataviz.adrientaudiere.com/terme/range-bar-chart.html},
  note      = {CC0 1.0}
}Fiche créée le 10/11/2026. Texte modifié le 10/11/2026. Images modifiées le 11/11/2026. Chiffres calculés le 22/10/2026.