

 graphique
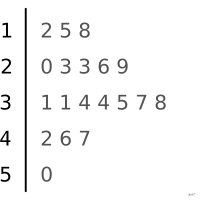
diagramme en tiges et feuilles
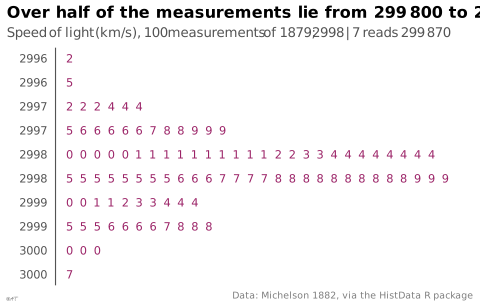
aussi : diagramme tige-et-feuillesDistribution où chaque valeur reste lisible, le chiffre de tête formant la tige et le suivant la feuille.
stem-and-leaf plot
Distribution where each value stays readable, the leading digit forming the stem and the next the leaf.
Dû à Tukey. Il montre la forme de la distribution sans perdre les valeurs, contrairement à l'histogramme.
Classification
- graphique
- texte
- distribution
- le nom évoque : nature
Canaux
 longueur; principal : effectif (longueur de la ligne de chiffres)
 région de l'espace; principal : classe (tige)
Attestation et synonymies
- terme français : Tillé, Résumé du cours de statistique descriptive avec une introduction au calcul de probabilités, cours, 2023↗
- définition anglaise : Tufte, The Visual Display of Quantitative Information, 2e éd., 2001
- diagramme branche-et-feuille; Wikipédia en français↗
Littérature scientifique
OpenAlex : 144 articles depuis 1986, dont 12 % ces cinq dernières années; surtout en Mathematics, Computer Science, Medicine; Wikidata
Références séminales
- invention (1972) Tukey (1972). Some graphic and semigraphic displays. In Statistical Papers in Honor of George W. Snedecor. Iowa State University Press; Friendly & Denis 2001
- diffusion (1977) Tukey (1977). Exploratory Data Analysis. Addison-Wesley; Wikipedia in English
Paquets R
- R
graphics::stem()R de base.
Code R de l'exemple ggplot2
library(ggplot2)
library(dplyr)
library(HistData)
## Speed of light, measured to the nearest 10 km/s: the hundreds make the
## stem, split in two (leaves 0-4, then 5-9), the tens the leaf.
leaves <- Michelson |>
mutate(v = 299000 + velocity, stem = v %/% 100, leaf = (v %/% 10) %% 10,
half = stem * 2 + (leaf >= 5)) |>
arrange(half, leaf) |>
group_by(half) |>
mutate(position = row_number()) |>
ungroup()
stems <- tibble(half = seq(min(leaves$half), max(leaves$half))) |>
mutate(label = half %/% 2)
p <- ggplot(leaves, aes(x = position, y = -half)) +
geom_text(aes(label = leaf), size = 3, colour = "#9b2367") +
geom_text(data = stems, aes(x = -0.6, y = -half, label = label), hjust = 1, size = 3, colour = "#535353") +
geom_vline(xintercept = 0, colour = "#535353", linewidth = 0.4) +
scale_x_continuous(limits = c(-3.5, 30), expand = c(0, 0)) +
labs(title = "Over half of the measurements lie from 299 800 to 299 890",
subtitle = "Speed of light (km/s), 100 measurements of 1879; 2998 | 7 reads 299 870",
x = NULL, y = NULL,
caption = "Data: Michelson 1882, via the HistData R package") +
theme_lex_viz(grid = "", arrows = "") +
theme(axis.text = element_blank())Sources (14)
29 occurrences dans le corpus; indexé par 6 ouvrages
Afficher les 14 sources
- Better data visualizations: a guide for scholars, researchers, and wonks
- Data Visualisation Guide, data.europa.eu
- Envisioning information
- Info we trust: how to inspire the world with data
- Les fondamentaux de la visualisation de données
- LibreTexts Statistics, chapitres de manuels sur les figures
- StatsLearn, glossaire « Graphs and displays »↗
- The grammar of graphics
- The visual display of quantitative information
- Thematic Cartography and Geovisualization
- Tillé, Résumé du cours de statistique descriptive avec une introduction au calcul de probabilités, cours, 2023↗
- Tufte, The Visual Display of Quantitative Information, 2e éd., 2001
- Visualizing with text
- Wikipedia in English↗
Citer cette fiche
Adresse stablehttps://dataviz.adrientaudiere.com/terme/stem-and-leaf-plot.html
RéférenceTaudière Adrien. 2026. diagramme en tiges et feuilles. Dans Visualization Vocabulary, version 1.0.0. IdEst. https://dataviz.adrientaudiere.com/terme/stem-and-leaf-plot.html
BibTeX
@incollection{taudiere2026-stem-and-leaf-plot,
  author    = {Taudière, Adrien},
  title     = {diagramme en tiges et feuilles},
  booktitle = {Visualization Vocabulary},
  year      = {2026},
  version   = {1.0.0},
  publisher = {IdEst},
  url       = {https://dataviz.adrientaudiere.com/terme/stem-and-leaf-plot.html},
  note      = {CC0 1.0}
}Fiche créée le 13/10/2026. Texte modifié le 02/11/2026. Images modifiées le 09/11/2026. Chiffres calculés le 22/10/2026.