
 graphique
diagramme en bandes
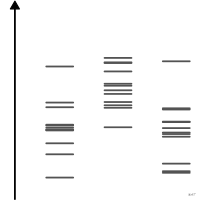
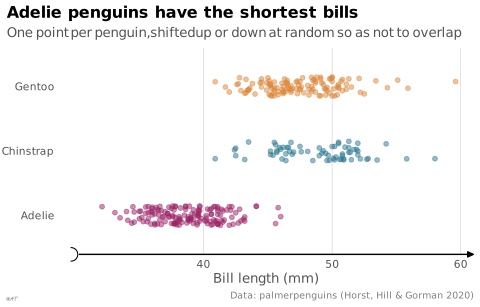
aussi : tracé en bandes de pointsValeurs individuelles projetées sur un axe unique.
strip plot
also: jitter plot, dot strip plot, strip chartIndividual values projected onto a single axis.
Classification
- graphique
- points et bulles › bandes de points
- classement, distribution; Visual Vocabulary du Financial Times
Canaux
 position sur une échelle commune; principal : valeur
 région de l'espace; secondaire : groupe
Variantes
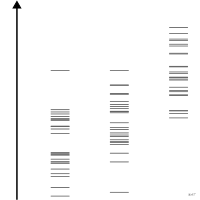 graphique en code-barrestraits fins
Attestation
- terme français : Visual Vocabulary du Financial Times, version française↗
Littérature scientifique
OpenAlex : 105 articles depuis 1996, dont 45 % ces cinq dernières années; surtout en Biochemistry, Genetics and Molecular Biology, Engineering, Medicine
Références séminales
- premier usage connu (1644) van Langren (1644). La Verdadera Longitud por Mar y Tierra. Anvers; Friendly & Denis 2001, Friendly & Wainer 2021
Paquets R
- R
ggplot2::geom_point(); GitHub 7 025 étoiles; dernier commit 2026-10; article (33 455 citations) Points alignés sur un axe, séparés par position = position_jitter().
Code R de l'exemple ggplot2
set.seed(20261014)
library(ggplot2)
library(palmerpenguins)
p <- ggplot(penguins, aes(x = bill_length_mm, y = species, colour = species)) +
geom_jitter(height = 0.15, width = 0, size = 1.4, alpha = 0.5, na.rm = TRUE) +
scale_x_continuous(labels = lex_number, breaks = lex_break_breaks, expand = lex_break_expand) +
labs(title = "Adelie penguins have the shortest bills",
subtitle = "One point per penguin, shifted up or down at random so as not to overlap",
x = "Bill length (mm)", y = NULL,
caption = "Data: palmerpenguins (Horst, Hill & Gorman 2020)") +
theme_lex_viz(grid = "x", arrows = "x", break_not_zero = "x") +
theme(legend.position = "none")Sources (15)
78 occurrences dans le corpus; indexé par 4 ouvrages
Afficher les 15 sources
- Better data visualizations: a guide for scholars, researchers, and wonks
- cedricscherer.com↗
- Data visualisation: a handbook for data driven design
- Data visualization handbook
- Data Viz Project
- datavizproject.com
- datawrapper.de↗
- Effective data storytelling: how to drive change with data, narrative, and visuals
- Information Graphics: A Comprehensive Illustrated Reference
- More Practical Charts
- Open Visualization Academy, cours et lettre d'information (Cairo et al.)
- Show me the numbers: designing tables and graphs to enlighten
- The art of insight: how great visualization designers think
- The Truthful Art: Data, Charts, and Maps for Communication
- Visual Vocabulary du Financial Times, version française↗
Citer cette fiche
Adresse stablehttps://dataviz.adrientaudiere.com/terme/strip-plot.html
RéférenceTaudière Adrien. 2026. diagramme en bandes. Dans Visualization Vocabulary, version 1.0.0. IdEst. https://dataviz.adrientaudiere.com/terme/strip-plot.html
BibTeX
@incollection{taudiere2026-strip-plot,
  author    = {Taudière, Adrien},
  title     = {diagramme en bandes},
  booktitle = {Visualization Vocabulary},
  year      = {2026},
  version   = {1.0.0},
  publisher = {IdEst},
  url       = {https://dataviz.adrientaudiere.com/terme/strip-plot.html},
  note      = {CC0 1.0}
}Fiche créée le 13/10/2026. Texte modifié le 22/10/2026. Images modifiées le 09/11/2026. Chiffres calculés le 22/10/2026.