

 graphique
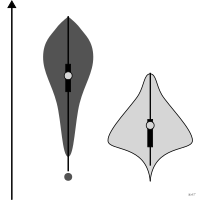
diagramme en violon
aussi : tracé en violonDensité de distribution symétrique de part et d'autre d'un axe.
violin plot
Distribution density mirrored on both sides of an axis.
Classification
- graphique
- boîtes et densités › formes de densité
- distribution; Visual Vocabulary du Financial Times
- le nom évoque : objet
Canaux
 position sur une échelle commune; principal : valeur
 longueur; principal : densité
 région de l'espace; principal : groupe
Variantes
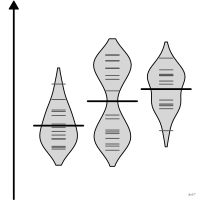 graphique en haricotsun trait par observation
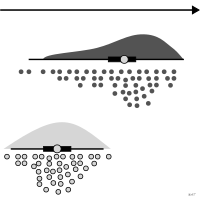 graphique en nuage de pluiedemi-violon avec boîte et points
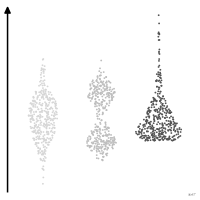 sina plotpoints écartés selon la densité
Attestation
- terme français : Visual Vocabulary du Financial Times, version française↗
- définition anglaise : Référence de ggplot2
Littérature scientifique
OpenAlex : 1 818 articles depuis 2004, dont 83 % ces cinq dernières années; surtout en Medicine, Biochemistry, Genetics and Molecular Biology, Computer Science; Wikidata
Références séminales
- invention (1998) Hintze & Nelson (1998). Violin Plots: A Box Plot-Density Trace Synergism. The American Statistician (1 855 citations)
Paquets R
- R
ggplot2::geom_violin(); GitHub 7 025 étoiles; dernier commit 2026-10; article (33 455 citations) - R
vioplot::vioplot(); GitHub 29 étoiles; dernier commit 2025-02; article (80 citations)
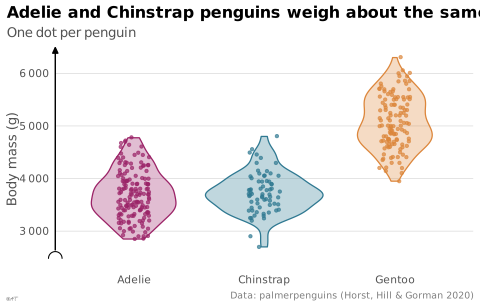
Code R de l'exemple ggplot2
library(ggplot2)
library(palmerpenguins)
set.seed(20261014)
p <- ggplot(penguins, aes(x = species, y = body_mass_g, fill = species, colour = species)) +
geom_violin(alpha = 0.3, na.rm = TRUE) +
geom_jitter(width = 0.12, size = 0.9, alpha = 0.7, na.rm = TRUE) +
scale_y_continuous(labels = lex_number, breaks = lex_break_breaks, expand = lex_break_expand) +
labs(title = "Adelie and Chinstrap penguins weigh about the same",
subtitle = "One dot per penguin",
x = NULL, y = "Body mass (g)",
caption = "Data: palmerpenguins (Horst, Hill & Gorman 2020)") +
theme_lex_viz(grid = "y", arrows = "y", break_not_zero = "y") +
theme(legend.position = "none")Sources (28)
30 occurrences dans le corpus; indexé par 6 ouvrages
Afficher les 28 sources
- app.flourish.studio
- Better data visualizations: a guide for scholars, researchers, and wonks
- Bremer & Barone, Chart, CRC Press, 2025
- cedricscherer.com↗
- Computational statistics in data science
- Data Feminism
- Data points: visualization that means something
- Data Visualisation Guide, data.europa.eu
- Data visualisation: a handbook for data driven design
- Data visualization handbook
- Data Viz Project
- dataphys.org
- datavizcatalogue.com
- datavizproject.com
- Effective data visualization: the right chart for the right data
- Exploratory Data Analysis: Descriptive Analysis, Visualization, and Dashboard Design (w...
- Grosjean & Engels, Science des données biologiques I-III (Université de Mons)
- Info we trust: how to inspire the world with data
- LibreTexts Statistics, chapitres de manuels sur les figures
- Référence de ggplot2
- Série d'ateliers R du CSBQ, version française (Centre de la science de la biodiversité du Québec)
- The Truthful Art: Data, Charts, and Maps for Communication
- Visual Vocabulary du Financial Times, version française↗
- Wickham, Navarro & Pedersen, ggplot2: Elegant Graphics for Data Analysis, 3e éd. en ligne↗
- Wikipédia — Visualisation de données
- Wikipédia en français↗
- Wikipedia in English↗
- Wilke, Fundamentals of Data Visualization, O'Reilly, 2019
Citer cette fiche
Adresse stablehttps://dataviz.adrientaudiere.com/terme/violin-plot.html
RéférenceTaudière Adrien. 2026. diagramme en violon. Dans Visualization Vocabulary, version 1.0.0. IdEst. https://dataviz.adrientaudiere.com/terme/violin-plot.html
BibTeX
@incollection{taudiere2026-violin-plot,
  author    = {Taudière, Adrien},
  title     = {diagramme en violon},
  booktitle = {Visualization Vocabulary},
  year      = {2026},
  version   = {1.0.0},
  publisher = {IdEst},
  url       = {https://dataviz.adrientaudiere.com/terme/violin-plot.html},
  note      = {CC0 1.0}
}Fiche créée le 13/10/2026. Texte modifié le 22/10/2026. Images modifiées le 02/11/2026. Chiffres calculés le 22/10/2026.