
 graphique
 en gaufre
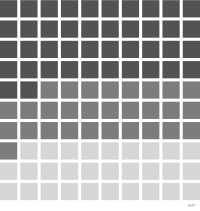
aussi : nuage de carrésGrille de carrés dont le nombre code une proportion.
waffle chart
also: square pieGrid of squares whose count encodes a proportion.
Classification
- graphique
- secteurs, pavages et unités › unités
- partie d'un tout; Visual Vocabulary du Financial Times
- le nom évoque : nature, nourriture
Canaux
 luminance; secondaire : catégorie
 saturation; secondaire : catégorie (à la place de la luminance)
 région de l'espace; principal : part (carrés regroupés)
 teinte; principal : catégorie
Attestation et synonymies
- terme français : Lagnel, Manuel de datavisualisation, Dunod, 2021
- définition anglaise : Data Visualisation Guide, data.europa.eu
- nuage de carrés; Lagnel, Manuel de datavisualisation, Dunod, 2021
Littérature scientifique
OpenAlex : 40 articles depuis 2017, dont 58 % ces cinq dernières années; surtout en Computer Science, Medicine, Decision Sciences
Références séminales
- premier usage connu (1902) Balogh & Proff (1902). A népfajok Magyarországon; The art of insight: how great visualization designers think
Paquets R
- R
waffle::geom_waffle(); GitHub 798 étoiles; dernier commit 2023-09 Retiré du CRAN : à installer depuis GitHub.
Code R de l'exemple ggplot2
library(ggplot2)
library(dplyr)
library(palmerpenguins)
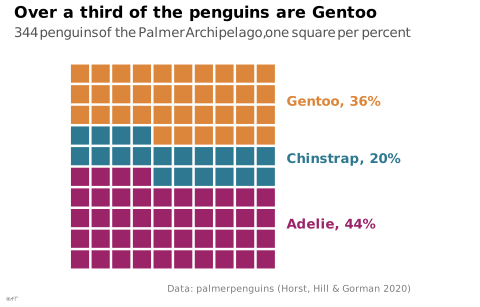
## Percentages rounded to whole squares: 44 + 20 + 36 = 100.
shares <- penguins |>
count(species) |>
mutate(squares = round(100 * n / sum(n)))
stopifnot(sum(shares$squares) == 100)
## Ten rows of ten squares, filled from the bottom left, row by row.
squares <- tibble(species = rep(shares$species, shares$squares),
position = 0:99,
x = position %% 10 + 1,
y = position %/% 10 + 1)
labels <- squares |>
group_by(species) |>
summarise(y = mean(y)) |>
left_join(shares, by = "species")
p <- ggplot(squares, aes(x = x, y = y, fill = species)) +
geom_tile(width = 0.88, height = 0.88) +
geom_text(data = labels, aes(x = 11, y = y, colour = species,
label = paste0(species, ", ", squares, "%")),
hjust = 0, size = 3.5, fontface = "bold", inherit.aes = FALSE) +
scale_x_continuous(limits = c(0.5, 17), expand = c(0, 0)) +
coord_equal() +
labs(title = "Over a third of the penguins are Gentoo",
subtitle = "344 penguins of the Palmer Archipelago, one square per percent",
x = NULL, y = NULL,
caption = "Data: palmerpenguins (Horst, Hill & Gorman 2020)") +
theme_lex_viz(grid = "", arrows = "") +
theme(legend.position = "none", axis.text = element_blank())Sources (12)
54 occurrences dans le corpus; indexé par 5 ouvrages
Afficher les 12 sources
- app.flourish.studio
- Better data visualizations: a guide for scholars, researchers, and wonks
- Data Visualisation Guide, data.europa.eu
- Data visualisation: a handbook for data driven design
- Data Viz Project
- datavizproject.com
- Effective data storytelling: how to drive change with data, narrative, and visuals
- Effective data visualization: the right chart for the right data
- Lagnel, Manuel de datavisualisation, Dunod, 2021
- Manuel de datavisualisation - 2e éd, vol. 2
- Storytelling with data: let's practice!
- Visualize This
Citer cette fiche
Adresse stablehttps://dataviz.adrientaudiere.com/terme/waffle-chart.html
RéférenceTaudière Adrien. 2026. graphique en gaufre. Dans Visualization Vocabulary, version 1.0.0. IdEst. https://dataviz.adrientaudiere.com/terme/waffle-chart.html
BibTeX
@incollection{taudiere2026-waffle-chart,
  author    = {Taudière, Adrien},
  title     = {graphique en gaufre},
  booktitle = {Visualization Vocabulary},
  year      = {2026},
  version   = {1.0.0},
  publisher = {IdEst},
  url       = {https://dataviz.adrientaudiere.com/terme/waffle-chart.html},
  note      = {CC0 1.0}
}Fiche créée le 13/10/2026. Texte modifié le 22/10/2026. Images modifiées le 11/11/2026. Chiffres calculés le 22/10/2026.