
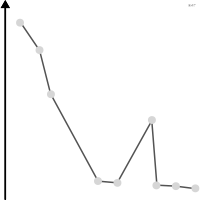
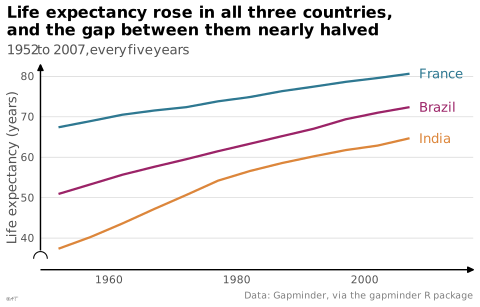

 chart
line chart
also: line graph, curve chartPoints joined by a line to show an ordered progression.
graphique en courbes
aussi : courbe, diagramme linéaire, graphique linéairePoints reliés par une ligne pour montrer une évolution ordonnée.
Classification
- chart
- lines and areas › lines
- change over time; Financial Times Visual Vocabulary
Channels
 position on common scale; main: value; time or order on the x-axis; Munzner 2014
 tilt/angle; secondary: variation (slope of the segments); Munzner 2014
 color hue; secondary: series; Munzner 2014
Variants
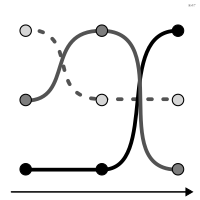 bump chartranks
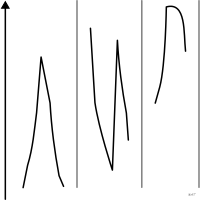 cycle plotsplit by cycle phase
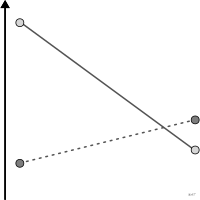 interaction plotspecial case
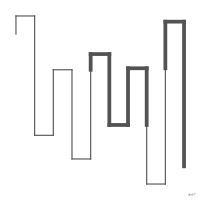 kagi chartwithout a time scale
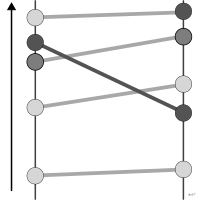 slopegraphtwo time points
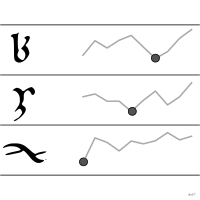 sparklineword-sized without axes
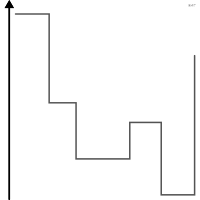 step chartstepped
Attestation and synonyms
- French term: Lagnel, Manuel de datavisualisation, Dunod, 2021
- English definition: Brinton, Graphic Presentation, 1939↗
Scientific literature
OpenAlex: 1 915 papers since 1921, 46% in the last five years; mostly in Computer Science, Medicine, Engineering; Wikidata
Seminal references
- first known use (1724) Cruquius (1724). Observationes accuratae circa mediam barometri altitudinem; Friendly & Denis 2001
- first known use (1786) Playfair (1786). The Commercial and Political Atlas; Friendly & Denis 2001, Andrews 2017, Ciuccarelli 2026
R packages
- R
ggplot2::geom_line(); GitHub 7 025 stars; last commit 2026-10; paper (33 455 citations)
R code of the ggplot2 example
library(ggplot2)
library(dplyr)
library(gapminder)
countries <- gapminder |>
filter(country %in% c("Brazil", "France", "India"))
p <- ggplot(countries, aes(x = year, y = lifeExp, colour = country)) +
geom_line(linewidth = 0.8) +
geom_text(data = filter(countries, year == max(year)), aes(label = country),
hjust = 0, nudge_x = 1.5, size = 3.5) +
scale_x_continuous(expand = expansion(mult = c(0.05, 0.15))) +
scale_y_continuous(labels = lex_number, breaks = lex_break_breaks, expand = lex_break_expand) +
labs(title = "Life expectancy rose in all three countries,\nand the gap between them nearly halved",
subtitle = "1952 to 2007, every five years",
x = NULL, y = "Life expectancy (years)",
caption = "Data: Gapminder, via the gapminder R package") +
theme_lex_viz(grid = "y", break_not_zero = "y") +
theme(legend.position = "none")Sources (85)
1213 occurrences in the corpus; indexed by 20 books
Show the 85 sources
- 100 diagrams that changed the world: from the earliest cave paintings to the innovation...
- analysisfunction.civilservice.gov.uk
- app.flourish.studio
- Atlas of knowledge: anyone can map
- Ault, Nam Liao & Musolino, Principles of Data Science, OpenStax, 2025
- Better data visualizations: a guide for scholars, researchers, and wonks
- blog.datawrapper.de↗
- Bremer & Barone, Chart, CRC Press, 2025
- Brinton, Graphic Presentation, 1939↗
- Cartographies of Time
- Cartography: thematic map design
- Data Feminism
- Data fluency: empowering your organization with effective data communication
- Data points: visualization that means something
- Data sketches
- Data story: explain data and inspire action through story
- Data Visualisation Guide, data.europa.eu
- Data visualisation: a handbook for data driven design
- Data visualization handbook
- Data visualization literacy: Definitions, conceptual frameworks, exercises, and assessm...
- Data visualization: a practical introduction
- Data-driven storytelling
- data-to-viz.com
- datawrapper.de↗
- Design for information: an introduction to the histories, theories, and best practices ...
- Effective data storytelling: how to drive change with data, narrative, and visuals
- Effective data visualization: the right chart for the right data
- Elavsky, Chartability: POUR-CAF accessibility heuristics
- Exploratory Data Analysis: Descriptive Analysis, Visualization, and Dashboard Design (w...
- Friendly & Wainer, A History of Data Visualization and Graphic Communication, Harvard University Press, 2021
- From data to viz
- Fundamentals of computer graphics
- Graphic presentation
- Graphical Perception: Theory, Experimentation, and Application to the Development of Gr...
- Graphics for learning: proven guidelines for planning, designing, and evaluating visual...
- Graphiques : vocabulaire, EBSI Montreal (after the GDT)↗
- How charts lie: getting smarter about visual information
- How maps work: representation, visualization, and design
- How to lie with statistics
- Info we trust: how to inspire the world with data
- Information graphics
- Information Graphics: A Comprehensive Illustrated Reference
- Information theory tools for visualization
- Interactive data visualization: foundations, techniques, and applications
- La graphique et le traitement graphique de l'information
- Lagnel, Manuel de datavisualisation, Dunod, 2021
- Les fondamentaux de la visualisation de données
- LibreTexts Statistics, textbook chapters on charts
- Making and Breaking the Grid, Third Edition
- Manuel de datavisualisation - 2e éd, vol. 2
- Milestones in the history of thematic cartography, statistical graphics, and data visua...
- More Practical Charts
- Open Visualization Academy, courses and newsletter (Cairo et al.)
- Practical charts: the essential guide to creating clear, compelling charts for reports ...
- Progressive Data Analysis: Roadmap and Research Agenda
- python-graph-gallery.com
- Questions in Dataviz: A Design-Driven Process for Data Visualisation
- Semiologie graphique: les diagrammes, les réseaux, les cartes.
- Semiology of graphics: diagrams, networks, maps
- Show me the numbers: designing tables and graphs to enlighten
- Storytelling with data: let's practice!
- The art of insight: how great visualization designers think
- The big book of dashboards: visualizing your data using real-world business scenarios
- The book of circles: visualizing spheres of knowledge
- The elements of graphing data
- The functional art: an introduction to information graphics and visualization
- The golden age of data visualization: how did we get here?
- The grammar of graphics
- The Minard System: The Complete Statistical Graphics of Charles-Joseph Minard
- The Truthful Art: Data, Charts, and Maps for Communication
- The visual display of quantitative information
- The Wall Street journal guide to information graphics: the dos and don'ts of presenting...
- Thematic Cartography and Geovisualization
- Visual complexity: mapping patterns of information
- Visual strategies for biological data
- Visualization Analysis and Design
- Visualization of Time-Oriented Data
- Visualize This
- Visualizing with text
- Wainer & Friendly, On the Origins of Data Visualization, 2022
- Wickham, Çetinkaya-Rundel & Grolemund, R for Data Science, 2nd ed., 2023
- Wickham, Navarro & Pedersen, ggplot2: Elegant Graphics for Data Analysis, 3rd ed. online↗
- Wikipedia — Data and information visualization
- Wikipedia in English↗
- xeno.graphics↗
Cite this entry
Stable addresshttps://dataviz.adrientaudiere.com/en/term/line-chart.html
ReferenceTaudière Adrien. 2026. line chart. In Visualization Vocabulary, version 1.0.0. IdEst. https://dataviz.adrientaudiere.com/en/term/line-chart.html
BibTeX
@incollection{taudiere2026-line-chart,
  author    = {Taudière, Adrien},
  title     = {line chart},
  booktitle = {Visualization Vocabulary},
  year      = {2026},
  version   = {1.0.0},
  publisher = {IdEst},
  url       = {https://dataviz.adrientaudiere.com/en/term/line-chart.html},
  note      = {CC0 1.0}
}Page created on 2026-10-13. Text last changed on 2026-11-12. Images last changed on 2026-11-12. Numbers computed on 2026-10-22.