
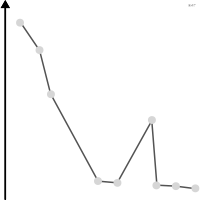

 graphique
 en courbes
aussi : courbe, diagramme linéaire, graphique linéairePoints reliés par une ligne pour montrer une évolution ordonnée.
line chart
also: line graph, curve chartPoints joined by a line to show an ordered progression.
Classification
- graphique
- courbes et aires › courbes
- évolution dans le temps; Visual Vocabulary du Financial Times
Canaux
 position sur une échelle commune; principal : valeur ; temps ou ordre en abscisse; Munzner 2014
 inclinaison ou angle; secondaire : variation (pente des segments); Munzner 2014
 teinte; secondaire : série; Munzner 2014
Variantes
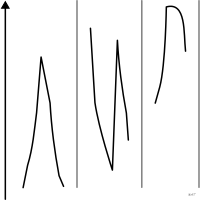 graphique cycliquedécoupé par phase du cycle
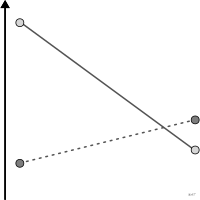 graphique d'interactioncas particulier
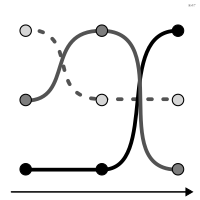 graphique de classementrangs
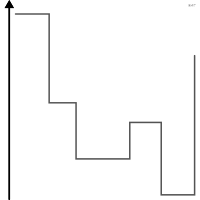 graphique en escalieren escalier
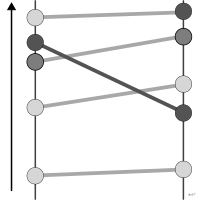 graphique en pentedeux dates
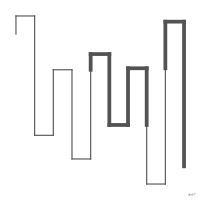 graphique Kagisans échelle de temps
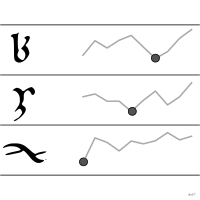 sparklineminiature sans axes
Attestation et synonymies
- terme français : Lagnel, Manuel de datavisualisation, Dunod, 2021
- définition anglaise : Brinton, Graphic Presentation, 1939↗
Littérature scientifique
OpenAlex : 1 915 articles depuis 1921, dont 46 % ces cinq dernières années; surtout en Computer Science, Medicine, Engineering; Wikidata
Références séminales
- premier usage connu (1724) Cruquius (1724). Observationes accuratae circa mediam barometri altitudinem; Friendly & Denis 2001
- premier usage connu (1786) Playfair (1786). The Commercial and Political Atlas; Friendly & Denis 2001, Andrews 2017, Ciuccarelli 2026
Paquets R
- R
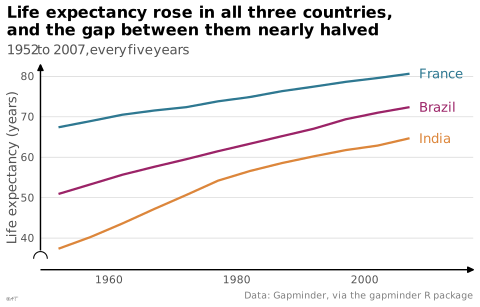
ggplot2::geom_line(); GitHub 7 025 étoiles; dernier commit 2026-10; article (33 455 citations)
Code R de l'exemple ggplot2
library(ggplot2)
library(dplyr)
library(gapminder)
countries <- gapminder |>
filter(country %in% c("Brazil", "France", "India"))
p <- ggplot(countries, aes(x = year, y = lifeExp, colour = country)) +
geom_line(linewidth = 0.8) +
geom_text(data = filter(countries, year == max(year)), aes(label = country),
hjust = 0, nudge_x = 1.5, size = 3.5) +
scale_x_continuous(expand = expansion(mult = c(0.05, 0.15))) +
scale_y_continuous(labels = lex_number, breaks = lex_break_breaks, expand = lex_break_expand) +
labs(title = "Life expectancy rose in all three countries,\nand the gap between them nearly halved",
subtitle = "1952 to 2007, every five years",
x = NULL, y = "Life expectancy (years)",
caption = "Data: Gapminder, via the gapminder R package") +
theme_lex_viz(grid = "y", break_not_zero = "y") +
theme(legend.position = "none")Sources (85)
1213 occurrences dans le corpus; indexé par 20 ouvrages
Afficher les 85 sources
- 100 diagrams that changed the world: from the earliest cave paintings to the innovation...
- analysisfunction.civilservice.gov.uk
- app.flourish.studio
- Atlas of knowledge: anyone can map
- Ault, Nam Liao & Musolino, Principles of Data Science, OpenStax, 2025
- Better data visualizations: a guide for scholars, researchers, and wonks
- blog.datawrapper.de↗
- Bremer & Barone, Chart, CRC Press, 2025
- Brinton, Graphic Presentation, 1939↗
- Cartographies of Time
- Cartography: thematic map design
- Data Feminism
- Data fluency: empowering your organization with effective data communication
- Data points: visualization that means something
- Data sketches
- Data story: explain data and inspire action through story
- Data Visualisation Guide, data.europa.eu
- Data visualisation: a handbook for data driven design
- Data visualization handbook
- Data visualization literacy: Definitions, conceptual frameworks, exercises, and assessm...
- Data visualization: a practical introduction
- Data-driven storytelling
- data-to-viz.com
- datawrapper.de↗
- Design for information: an introduction to the histories, theories, and best practices ...
- Effective data storytelling: how to drive change with data, narrative, and visuals
- Effective data visualization: the right chart for the right data
- Elavsky, Chartability : heuristiques d'accessibilité POUR-CAF
- Exploratory Data Analysis: Descriptive Analysis, Visualization, and Dashboard Design (w...
- Friendly & Wainer, A History of Data Visualization and Graphic Communication, Harvard University Press, 2021
- From data to viz
- Fundamentals of computer graphics
- Graphic presentation
- Graphical Perception: Theory, Experimentation, and Application to the Development of Gr...
- Graphics for learning: proven guidelines for planning, designing, and evaluating visual...
- Graphiques : vocabulaire, EBSI Montréal (d'après le GDT)↗
- How charts lie: getting smarter about visual information
- How maps work: representation, visualization, and design
- How to lie with statistics
- Info we trust: how to inspire the world with data
- Information graphics
- Information Graphics: A Comprehensive Illustrated Reference
- Information theory tools for visualization
- Interactive data visualization: foundations, techniques, and applications
- La graphique et le traitement graphique de l'information
- Lagnel, Manuel de datavisualisation, Dunod, 2021
- Les fondamentaux de la visualisation de données
- LibreTexts Statistics, chapitres de manuels sur les figures
- Making and Breaking the Grid, Third Edition
- Manuel de datavisualisation - 2e éd, vol. 2
- Milestones in the history of thematic cartography, statistical graphics, and data visua...
- More Practical Charts
- Open Visualization Academy, cours et lettre d'information (Cairo et al.)
- Practical charts: the essential guide to creating clear, compelling charts for reports ...
- Progressive Data Analysis: Roadmap and Research Agenda
- python-graph-gallery.com
- Questions in Dataviz: A Design-Driven Process for Data Visualisation
- Semiologie graphique: les diagrammes, les réseaux, les cartes.
- Semiology of graphics: diagrams, networks, maps
- Show me the numbers: designing tables and graphs to enlighten
- Storytelling with data: let's practice!
- The art of insight: how great visualization designers think
- The big book of dashboards: visualizing your data using real-world business scenarios
- The book of circles: visualizing spheres of knowledge
- The elements of graphing data
- The functional art: an introduction to information graphics and visualization
- The golden age of data visualization: how did we get here?
- The grammar of graphics
- The Minard System: The Complete Statistical Graphics of Charles-Joseph Minard
- The Truthful Art: Data, Charts, and Maps for Communication
- The visual display of quantitative information
- The Wall Street journal guide to information graphics: the dos and don'ts of presenting...
- Thematic Cartography and Geovisualization
- Visual complexity: mapping patterns of information
- Visual strategies for biological data
- Visualization Analysis and Design
- Visualization of Time-Oriented Data
- Visualize This
- Visualizing with text
- Wainer & Friendly, On the Origins of Data Visualization, 2022
- Wickham, Çetinkaya-Rundel & Grolemund, R for Data Science, 2e éd., 2023
- Wickham, Navarro & Pedersen, ggplot2: Elegant Graphics for Data Analysis, 3e éd. en ligne↗
- Wikipedia — Data and information visualization
- Wikipedia in English↗
- xeno.graphics↗
Citer cette fiche
Adresse stablehttps://dataviz.adrientaudiere.com/terme/line-chart.html
RéférenceTaudière Adrien. 2026. graphique en courbes. Dans Visualization Vocabulary, version 1.0.0. IdEst. https://dataviz.adrientaudiere.com/terme/line-chart.html
BibTeX
@incollection{taudiere2026-line-chart,
  author    = {Taudière, Adrien},
  title     = {graphique en courbes},
  booktitle = {Visualization Vocabulary},
  year      = {2026},
  version   = {1.0.0},
  publisher = {IdEst},
  url       = {https://dataviz.adrientaudiere.com/terme/line-chart.html},
  note      = {CC0 1.0}
}Fiche créée le 13/10/2026. Texte modifié le 12/11/2026. Images modifiées le 12/11/2026. Chiffres calculés le 22/10/2026.