
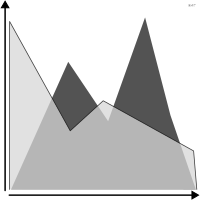
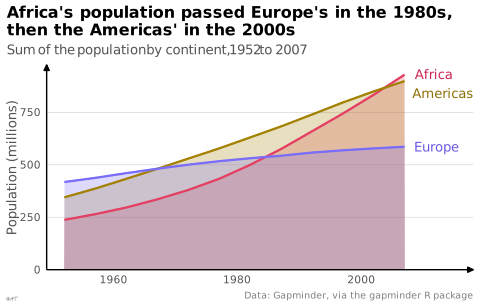

 graphique
 en aires
aussi : courbe pleineCourbe dont la surface sous la ligne est remplie.
area chart
also: area graphLine chart with the area under the line filled in.
Piège de traduction : le Visual Vocabulary français rend « area chart » par « carte de région », en lisant area comme une aire géographique. Il s'agit bien d'une courbe dont la surface est remplie, dans la rubrique évolution dans le temps.
Classification
- graphique
- courbes et aires › aires
- évolution dans le temps; Visual Vocabulary du Financial Times
Canaux
 position sur une échelle commune; principal : valeur
 aire; principal : distribution
 teinte; principal : série
Variantes
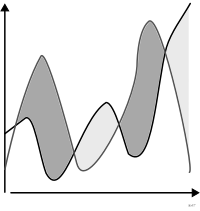 courbe d'excédent et de déficitdivergent
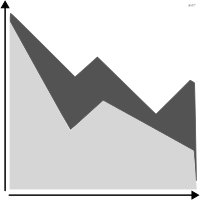 graphique en aires empiléesempilé
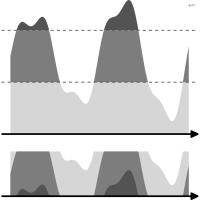 graphique en horizonreplié en bandes
Attestation
- terme français : Lagnel, Manuel de datavisualisation, Dunod, 2021
- définition anglaise : Data Visualisation Guide, data.europa.eu
Littérature scientifique
OpenAlex : 412 articles depuis 1944, dont 33 % ces cinq dernières années; surtout en Computer Science, Medicine, Engineering; Wikidata
Références séminales
- premier usage connu (1786) Playfair (1786). The Commercial and Political Atlas; Ciuccarelli 2026
Paquets R
- R
ggplot2::geom_area(); GitHub 7 025 étoiles; dernier commit 2026-10; article (33 455 citations)
Code R de l'exemple ggplot2
library(ggplot2)
library(dplyr)
library(gapminder)
library(ggrepel)
continents <- gapminder |>
filter(continent %in% c("Africa", "Americas", "Europe")) |>
group_by(continent, year) |>
summarise(pop = sum(as.numeric(pop)) / 1e6, .groups = "drop")
ends <- filter(continents, year == max(year))
p <- ggplot(continents, aes(x = year, y = pop, fill = continent, colour = continent)) +
geom_area(position = "identity", alpha = 0.25) +
geom_line(linewidth = 0.8) +
geom_text_repel(data = ends, aes(label = continent),
colour = continent_text_colors[as.character(ends$continent)], hjust = 0, nudge_x = 1.5, direction = "y", segment.colour = NA, size = 3.5,
family = "Quicksand") +
scale_x_continuous(expand = expansion(mult = c(0.05, 0.17))) +
scale_y_continuous(labels = lex_number, expand = expansion(mult = c(0, 0.05))) +
scale_fill_manual(values = continent_colors) +
scale_colour_manual(values = continent_colors) +
labs(title = "Africa's population passed Europe's in the 1980s,\nthen the Americas' in the 2000s",
subtitle = "Sum of the population by continent, 1952 to 2007",
x = NULL, y = "Population (millions)",
caption = "Data: Gapminder, via the gapminder R package") +
theme_lex_viz(grid = "y") +
theme(legend.position = "none")Sources (49)
331 occurrences dans le corpus; indexé par 9 ouvrages
Afficher les 49 sources
- app.flourish.studio
- Atlas of knowledge: anyone can map
- Better data visualizations: a guide for scholars, researchers, and wonks
- Bremer & Barone, Chart, CRC Press, 2025
- Data Feminism
- Data fluency: empowering your organization with effective data communication
- Data points: visualization that means something
- Data sketches
- Data Visualisation Guide, data.europa.eu
- Data visualisation: a handbook for data driven design
- Data visualization handbook
- Data Viz Project
- data-to-viz.com
- dataphys.org
- datavizcatalogue.com
- datavizproject.com
- datawrapper.de↗
- Design for information: an introduction to the histories, theories, and best practices ...
- Effective data storytelling: how to drive change with data, narrative, and visuals
- Effective data visualization: the right chart for the right data
- Exploratory Data Analysis: Descriptive Analysis, Visualization, and Dashboard Design (w...
- Friendly & Wainer, A History of Data Visualization and Graphic Communication, Harvard University Press, 2021
- From data to viz
- Information Graphics: A Comprehensive Illustrated Reference
- Insee, Guide de sémiologie graphique, édition 2017↗
- Lagnel, Manuel de datavisualisation, Dunod, 2021
- Les fondamentaux de la visualisation de données
- Milestones in the history of thematic cartography, statistical graphics, and data visua...
- Open Visualization Academy, cours et lettre d'information (Cairo et al.)
- Practical charts: the essential guide to creating clear, compelling charts for reports ...
- python-graph-gallery.com
- Questions in Dataviz: A Design-Driven Process for Data Visualisation
- Show me the numbers: designing tables and graphs to enlighten
- Storytelling with data: let's practice!
- The art of insight: how great visualization designers think
- The big book of dashboards: visualizing your data using real-world business scenarios
- The book of circles: visualizing spheres of knowledge
- The golden age of data visualization: how did we get here?
- The grammar of graphics
- The Truthful Art: Data, Charts, and Maps for Communication
- The Wall Street journal guide to information graphics: the dos and don'ts of presenting...
- Visualization Analysis and Design
- Visualization of Time-Oriented Data
- Visualize This
- Wickham, Çetinkaya-Rundel & Grolemund, R for Data Science, 2e éd., 2023
- Wikipedia — Data and information visualization
- Wikipédia — Visualisation de données
- Wikipédia en français↗
- Wikipedia in English↗
Citer cette fiche
Adresse stablehttps://dataviz.adrientaudiere.com/terme/area-chart.html
RéférenceTaudière Adrien. 2026. graphique en aires. Dans Visualization Vocabulary, version 1.0.0. IdEst. https://dataviz.adrientaudiere.com/terme/area-chart.html
BibTeX
@incollection{taudiere2026-area-chart,
  author    = {Taudière, Adrien},
  title     = {graphique en aires},
  booktitle = {Visualization Vocabulary},
  year      = {2026},
  version   = {1.0.0},
  publisher = {IdEst},
  url       = {https://dataviz.adrientaudiere.com/terme/area-chart.html},
  note      = {CC0 1.0}
}Fiche créée le 13/10/2026. Texte modifié le 12/11/2026. Images modifiées le 12/11/2026. Chiffres calculés le 22/10/2026.