
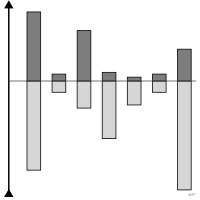
 chart
diverging bar chart
also: diverging barBars running up or down from a reference line according to sign.
Classification
- chart
- bars › diverging bars
- deviation; Financial Times Visual Vocabulary
Channels
 position on common scale; main: signed value
 length; main: deviation from the reference
 spatial region; main: sign
 color hue; secondary: sign
Variants
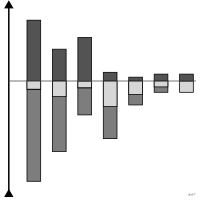 diverging stacked bar chartstacked
- spine chartspecial case
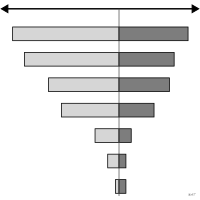 tornado chartsorted by range
Attestation
- English definition: Financial Times Visual Vocabulary
Scientific literature
OpenAlex: 21 papers since 2021, 76% in the last five years; mostly in Computer Science, Medicine, Agricultural and Biological Sciences
R packages
- R
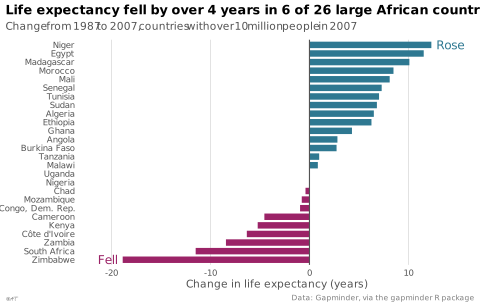
ggplot2::geom_col(); tutorial; GitHub 7 025 stars; last commit 2026-10; paper (33 455 citations)
R code of the ggplot2 example
library(ggplot2)
library(dplyr)
library(gapminder)
## African countries of over 10 million people in 2007.
change <- gapminder |>
filter(continent == "Africa") |>
group_by(country) |>
filter(pop[year == 2007] >= 1e7, year %in% c(1987, 2007)) |>
summarise(change = diff(lifeExp)) |>
mutate(country = reorder(sub("^Cote d'Ivoire$", "Côte d'Ivoire", as.character(country)), change),
direction = ifelse(change < 0, "Fell", "Rose"))
## Each word goes past the longest bar of its side.
ends <- change |>
group_by(direction) |>
slice_max(abs(change), n = 1)
p <- ggplot(change, aes(x = change, y = country, fill = direction)) +
geom_col(width = 0.75) +
geom_vline(xintercept = 0, colour = "#535353", linewidth = 0.4) +
geom_text(data = ends, aes(label = direction, colour = direction,
hjust = ifelse(change < 0, 1, 0)),
nudge_x = ifelse(ends$change < 0, -0.5, 0.5), size = 3.2) +
scale_x_continuous(labels = lex_number, expand = expansion(mult = 0.12)) +
labs(title = "Life expectancy fell by over 4 years in 6 of 26 large African countries",
subtitle = "Change from 1987 to 2007, countries with over 10 million people in 2007",
x = "Change in life expectancy (years)", y = NULL,
caption = "Data: Gapminder, via the gapminder R package") +
theme_lex_viz(base_size = 8, grid = "x", arrows = "") +
theme(legend.position = "none")Sources (7)
20 occurrences in the corpus; indexed by 2 books
- app.flourish.studio
- Better data visualizations: a guide for scholars, researchers, and wonks
- Data visualisation: a handbook for data driven design
- Effective data storytelling: how to drive change with data, narrative, and visuals
- Effective data visualization: the right chart for the right data
- Financial Times Visual Vocabulary
- The big book of dashboards: visualizing your data using real-world business scenarios
Cite this entry
Stable addresshttps://dataviz.adrientaudiere.com/en-only/term/diverging-bar-chart.html
ReferenceTaudière Adrien. 2026. diverging bar chart. In Visualization Vocabulary, version 1.0.0. IdEst. https://dataviz.adrientaudiere.com/en-only/term/diverging-bar-chart.html
BibTeX
@incollection{taudiere2026-diverging-bar-chart,
  author    = {Taudière, Adrien},
  title     = {diverging bar chart},
  booktitle = {Visualization Vocabulary},
  year      = {2026},
  version   = {1.0.0},
  publisher = {IdEst},
  url       = {https://dataviz.adrientaudiere.com/en-only/term/diverging-bar-chart.html},
  note      = {CC0 1.0}
}Page created on 2026-10-13. Text last changed on 2026-11-12. Images last changed on 2026-11-12. Numbers computed on 2026-10-22.