
 chart
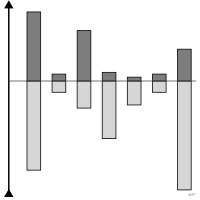
diverging bar chart
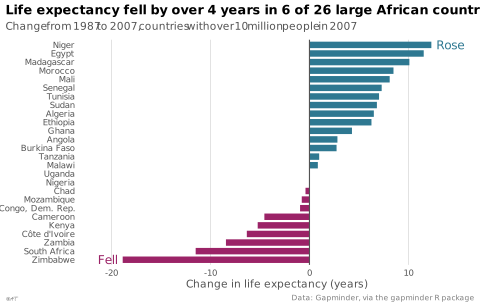
also: diverging barBars running up or down from a reference line according to sign.
diagramme en barres divergentes
aussi : barre divergenteBarres partant d'une ligne de référence vers le haut ou vers le bas selon le signe.
La ligne de référence est le plus souvent zéro, parfois une cible ou une moyenne de longue période.
Classification
- chart
- bars › diverging bars
- deviation; Financial Times Visual Vocabulary
Channels
 position on common scale; main: signed value
 length; main: deviation from the reference
 spatial region; main: sign
 color hue; secondary: sign
Variants
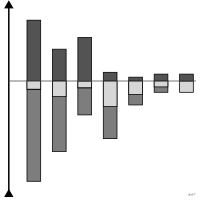 diverging stacked bar chartstacked
- spine chartspecial case
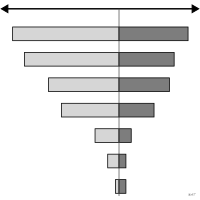 tornado chartsorted by range
Attestation
- French term: Financial Times Visual Vocabulary, French version↗
- English definition: Financial Times Visual Vocabulary
Scientific literature
OpenAlex: 21 papers since 2021, 76% in the last five years; mostly in Computer Science, Medicine, Agricultural and Biological Sciences
R packages
- R
ggplot2::geom_col(); tutorial; GitHub 7 025 stars; last commit 2026-10; paper (33 455 citations) Valeurs négatives sous la ligne de référence.
R code of the ggplot2 example
library(ggplot2)
library(dplyr)
library(gapminder)
## African countries of over 10 million people in 2007.
change <- gapminder |>
filter(continent == "Africa") |>
group_by(country) |>
filter(pop[year == 2007] >= 1e7, year %in% c(1987, 2007)) |>
summarise(change = diff(lifeExp)) |>
mutate(country = reorder(sub("^Cote d'Ivoire$", "Côte d'Ivoire", as.character(country)), change),
direction = ifelse(change < 0, "Fell", "Rose"))
## Each word goes past the longest bar of its side.
ends <- change |>
group_by(direction) |>
slice_max(abs(change), n = 1)
p <- ggplot(change, aes(x = change, y = country, fill = direction)) +
geom_col(width = 0.75) +
geom_vline(xintercept = 0, colour = "#535353", linewidth = 0.4) +
geom_text(data = ends, aes(label = direction, colour = direction,
hjust = ifelse(change < 0, 1, 0)),
nudge_x = ifelse(ends$change < 0, -0.5, 0.5), size = 3.2) +
scale_x_continuous(labels = lex_number, expand = expansion(mult = 0.12)) +
labs(title = "Life expectancy fell by over 4 years in 6 of 26 large African countries",
subtitle = "Change from 1987 to 2007, countries with over 10 million people in 2007",
x = "Change in life expectancy (years)", y = NULL,
caption = "Data: Gapminder, via the gapminder R package") +
theme_lex_viz(base_size = 8, grid = "x", arrows = "") +
theme(legend.position = "none")Sources (8)
20 occurrences in the corpus; indexed by 2 books
- app.flourish.studio
- Better data visualizations: a guide for scholars, researchers, and wonks
- Data visualisation: a handbook for data driven design
- Effective data storytelling: how to drive change with data, narrative, and visuals
- Effective data visualization: the right chart for the right data
- Financial Times Visual Vocabulary
- Financial Times Visual Vocabulary, French version↗
- The big book of dashboards: visualizing your data using real-world business scenarios
Cite this entry
Stable addresshttps://dataviz.adrientaudiere.com/en/term/diverging-bar-chart.html
ReferenceTaudière Adrien. 2026. diverging bar chart. In Visualization Vocabulary, version 1.0.0. IdEst. https://dataviz.adrientaudiere.com/en/term/diverging-bar-chart.html
BibTeX
@incollection{taudiere2026-diverging-bar-chart,
  author    = {Taudière, Adrien},
  title     = {diverging bar chart},
  booktitle = {Visualization Vocabulary},
  year      = {2026},
  version   = {1.0.0},
  publisher = {IdEst},
  url       = {https://dataviz.adrientaudiere.com/en/term/diverging-bar-chart.html},
  note      = {CC0 1.0}
}Page created on 2026-10-13. Text last changed on 2026-11-12. Images last changed on 2026-11-12. Numbers computed on 2026-10-22.