
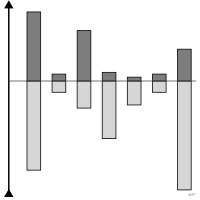
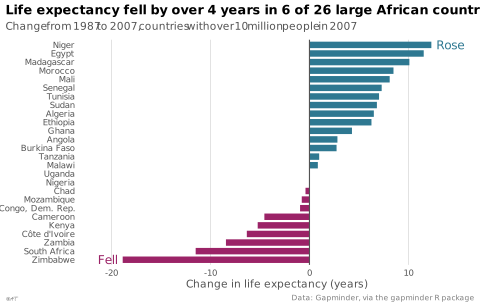
 graphique
diagramme en barres divergentes
aussi : barre divergenteBarres partant d'une ligne de référence vers le haut ou vers le bas selon le signe.
diverging bar chart
also: diverging barBars running up or down from a reference line according to sign.
La ligne de référence est le plus souvent zéro, parfois une cible ou une moyenne de longue période.
Classification
- graphique
- barres › barres divergentes
- écart; Visual Vocabulary du Financial Times
Canaux
 position sur une échelle commune; principal : valeur signée
 longueur; principal : écart à la référence
 région de l'espace; principal : signe
 teinte; secondaire : signe
Variantes
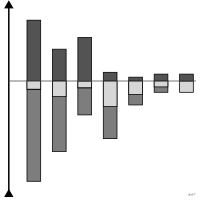 barres empilées divergentesempilé
- graphique en épinecas particulier
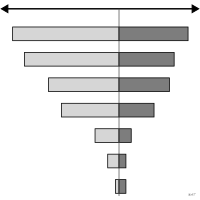 graphique tornadeclassé par amplitude
Attestation
- terme français : Visual Vocabulary du Financial Times, version française↗
- définition anglaise : Visual Vocabulary du Financial Times
Littérature scientifique
OpenAlex : 21 articles depuis 2021, dont 76 % ces cinq dernières années; surtout en Computer Science, Medicine, Agricultural and Biological Sciences
Paquets R
- R
ggplot2::geom_col(); tutoriel; GitHub 7 025 étoiles; dernier commit 2026-10; article (33 455 citations) Valeurs négatives sous la ligne de référence.
Code R de l'exemple ggplot2
library(ggplot2)
library(dplyr)
library(gapminder)
## African countries of over 10 million people in 2007.
change <- gapminder |>
filter(continent == "Africa") |>
group_by(country) |>
filter(pop[year == 2007] >= 1e7, year %in% c(1987, 2007)) |>
summarise(change = diff(lifeExp)) |>
mutate(country = reorder(sub("^Cote d'Ivoire$", "Côte d'Ivoire", as.character(country)), change),
direction = ifelse(change < 0, "Fell", "Rose"))
## Each word goes past the longest bar of its side.
ends <- change |>
group_by(direction) |>
slice_max(abs(change), n = 1)
p <- ggplot(change, aes(x = change, y = country, fill = direction)) +
geom_col(width = 0.75) +
geom_vline(xintercept = 0, colour = "#535353", linewidth = 0.4) +
geom_text(data = ends, aes(label = direction, colour = direction,
hjust = ifelse(change < 0, 1, 0)),
nudge_x = ifelse(ends$change < 0, -0.5, 0.5), size = 3.2) +
scale_x_continuous(labels = lex_number, expand = expansion(mult = 0.12)) +
labs(title = "Life expectancy fell by over 4 years in 6 of 26 large African countries",
subtitle = "Change from 1987 to 2007, countries with over 10 million people in 2007",
x = "Change in life expectancy (years)", y = NULL,
caption = "Data: Gapminder, via the gapminder R package") +
theme_lex_viz(base_size = 8, grid = "x", arrows = "") +
theme(legend.position = "none")Sources (8)
20 occurrences dans le corpus; indexé par 2 ouvrages
- app.flourish.studio
- Better data visualizations: a guide for scholars, researchers, and wonks
- Data visualisation: a handbook for data driven design
- Effective data storytelling: how to drive change with data, narrative, and visuals
- Effective data visualization: the right chart for the right data
- The big book of dashboards: visualizing your data using real-world business scenarios
- Visual Vocabulary du Financial Times
- Visual Vocabulary du Financial Times, version française↗
Citer cette fiche
Adresse stablehttps://dataviz.adrientaudiere.com/terme/diverging-bar-chart.html
RéférenceTaudière Adrien. 2026. diagramme en barres divergentes. Dans Visualization Vocabulary, version 1.0.0. IdEst. https://dataviz.adrientaudiere.com/terme/diverging-bar-chart.html
BibTeX
@incollection{taudiere2026-diverging-bar-chart,
  author    = {Taudière, Adrien},
  title     = {diagramme en barres divergentes},
  booktitle = {Visualization Vocabulary},
  year      = {2026},
  version   = {1.0.0},
  publisher = {IdEst},
  url       = {https://dataviz.adrientaudiere.com/terme/diverging-bar-chart.html},
  note      = {CC0 1.0}
}Fiche créée le 13/10/2026. Texte modifié le 12/11/2026. Images modifiées le 12/11/2026. Chiffres calculés le 22/10/2026.